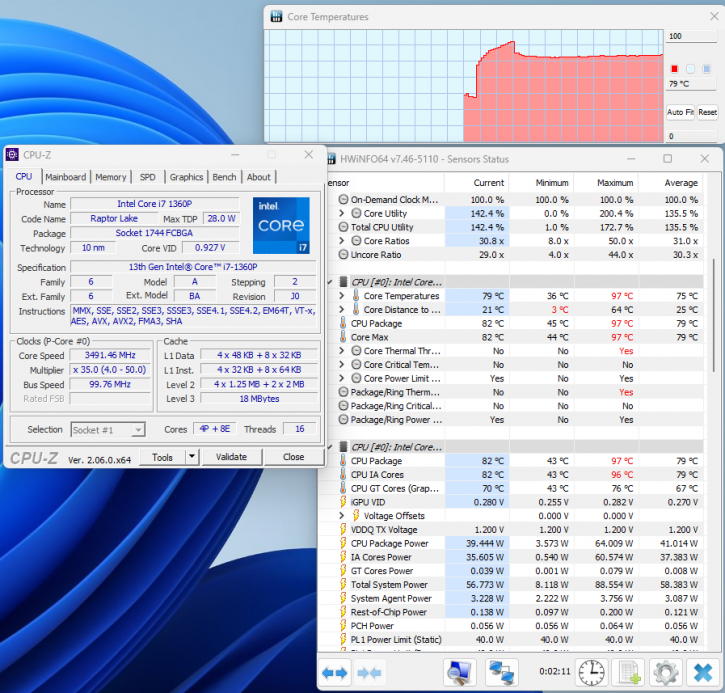
Thermals and CPU Temperatures
Thermals
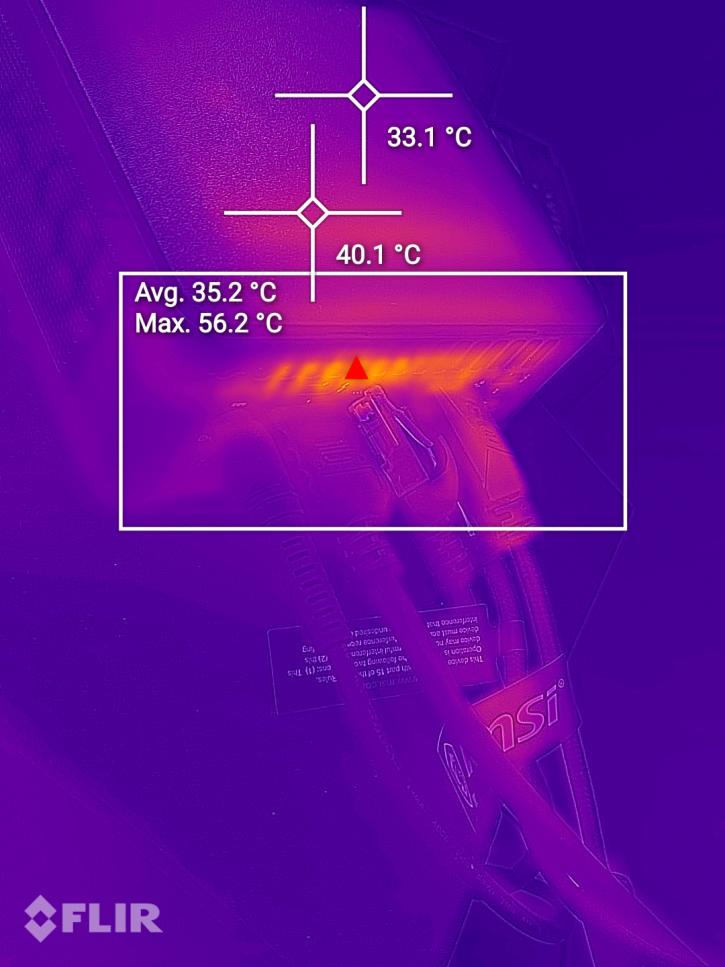
Lately, it has been requested if we could list VRM temperatures. We could hook into sensors and start measuring. Now a good way really is to look at the VRM area with a thermal camera. This way you can detect hot-spots and/or worrying stuff. We run the FPU and CPU torture test in AIDA. The chart plot shows the maximum VRM temperature measured at thermal sensor level. The VRM temperatures you see listed in the chart are not based upon the thermal image, but the max temp reported by the thermal sensors at the VRM stages.
- System setup: normal conditions / default settings / 100% CPU load on all cores
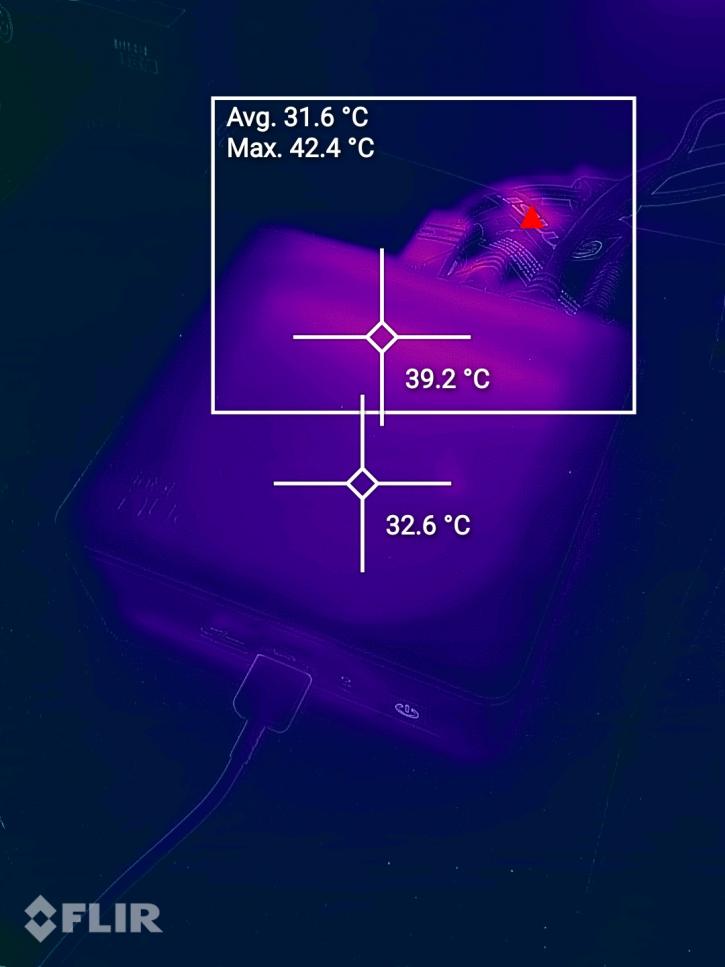
Above all CPU cores under load
Temperatures
The reason we do not table/chart up temperature results is that we'd need to apply identically cooling over and over on all platforms. Also, coolers (RPM) react differently to TDP and variables like BIOS on all motherboards, let alone brands. The processor peaks towards 90+ Degrees C and then very slowly drops towards 80 degrees C; at these levels, it's getting somewhat noisy. But during long-term CPU stress, expect 80 Degrees C on the processor package. During full load the unit will reach its thermal limits ergo throttling will occur.