
FCAT Frame Analysis
Frametime and latency performance
With FCAT we will look into Frame Experience Analysis. Basically with the charts shown we are trying to show you graphics anomalies like stutters and glitches in a plotted chart. There has been a measurement introduced, latency measurements. Basically, it is the opposite of FPS.
- FPS mostly measures performance, the number of frames rendered per passing second.
- Frametime AKA Frame Experience recordings mostly measures and expose anomalies - here we look at how long it takes to render one frame. Measure that chronologically and you can see anomalies like peaks and dips in a plotted chart, indicating something could be off.
| Frame time in milliseconds |
FPS |
| 8.3 | 120 |
| 15 | 66 |
| 20 | 50 |
| 25 | 40 |
| 30 | 33 |
| 50 | 20 |
| 70 | 14 |
We have a detailed article (read here) on the new FCAT methodology used, and it also explains why we do not use FRAPS anymore. Frametime - Basically the time it takes to render one frame can be monitored and tagged with a number, this is latency. One frame can take say 17 ms. Higher latency can indicate a slow framerate, and weird latency spikes indicate a stutter, jitter, twitches; basically, anomalies that are visible on your monitor.
What Do These Measurements Show?
What these measurements show are anomalies like small glitches and stutters that you can sometimes (and please do read that well, sometimes) see on screen. Below I'd like to run through a couple of titles with you. Bear in mind that Average FPS often matters more than frame-time measurements.
For this interested, in the above video, you can see the actual FRAPS recording, each frame rendered gets a color label so that we can analyze the scene tested. Each run is 30 seconds precisely.
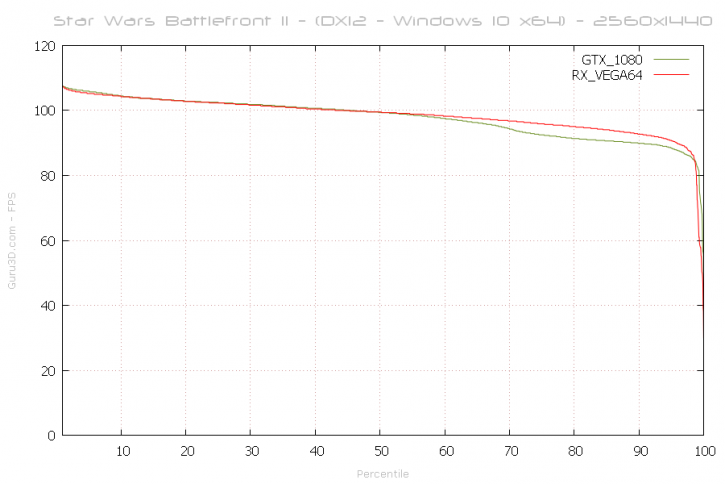
Above, the percentile chart of a 31-second recording @ 2560x1440. Here we plot relative FPS and place it in relation to percentiles. 50% of the time measured frames is the average framerate (higher = better). Today we'll use a Radeon RX Vega 64 and a GeForce GTX 1080, as you can see both are performing quite close to each other at this monitor resolution.
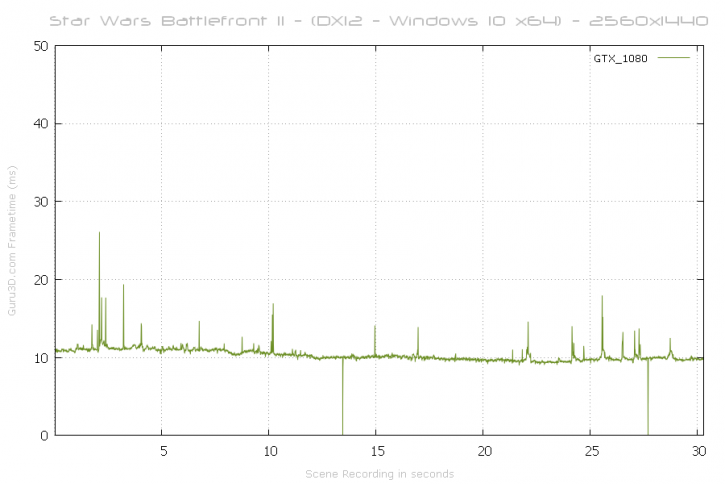
With this chart, lower = better. Huge spikes above 40 ms to 50 ms can be considered a problem like a stutter or indicate a low framerate. It's all good fairly here. For the GeForce GTX 1080, we cannot see a significant enough glitch or stutter in frame-time scaling (chart wise) that is significant or long-lasting. The small spikes are shots fired and me zooming into the sniper mode of the rifle (and firing).
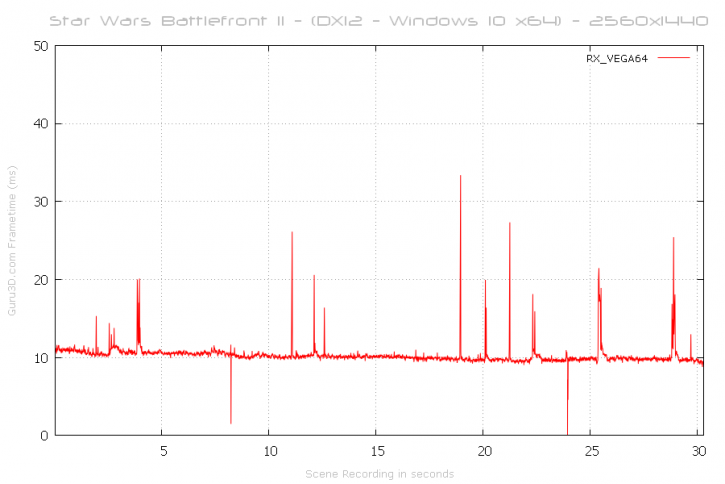
For the Radeon RX Vega 64, we also see the very similar behavior, the spikes go up in frame time a little higher than the GTX 1080, but it is hardly noticeable though. Again, these spikes are shots fired and me zooming into the sniper mode of the rifle (and firing).
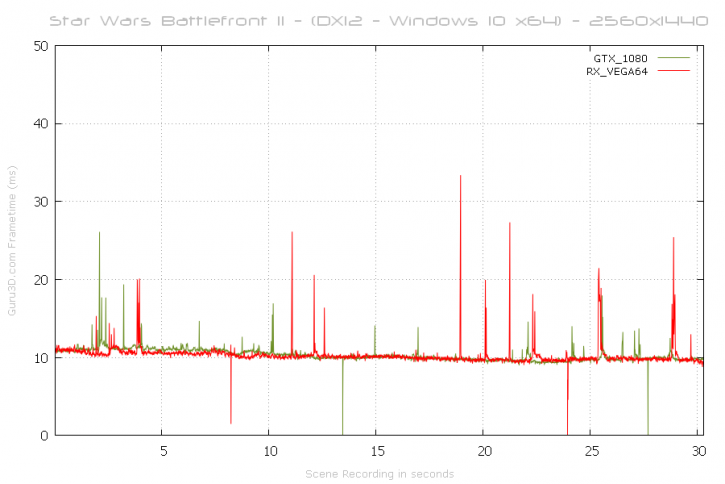
And combined with an overlay, the cards both perform equally well and fairly similar towards each other. Smooth sailing for both brands.
