DX12: FCAT Frame Experience Analysis Ashes Of Singularity
Ashes Of Singularity Frame Experience Analysis
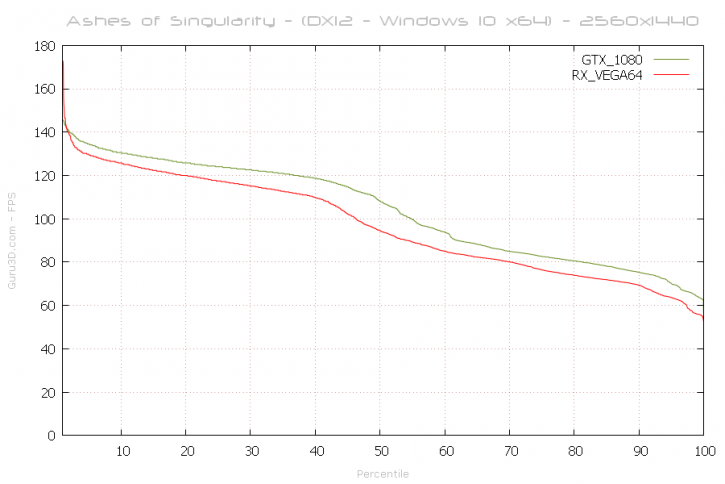
Above, the percentile chart of a 31 second recording @ 2560x1440. Here we plot FPS and place it in relation to percentiles. We do have DirectX 12 enabled again. 50% of the time measured frames is roughly the average framerate (higher = better).
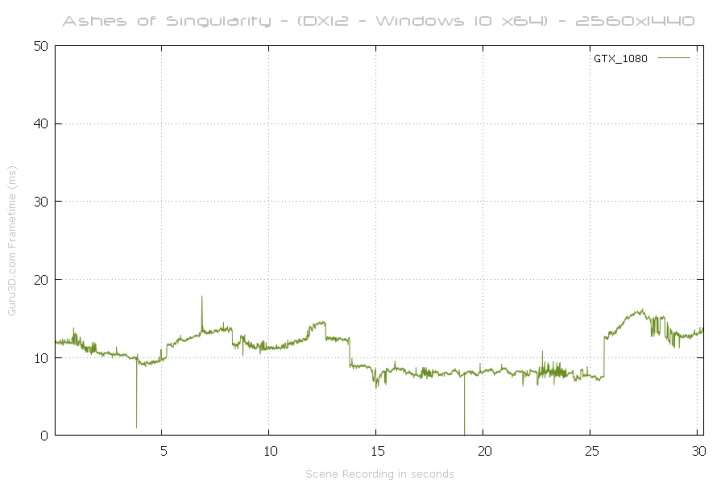
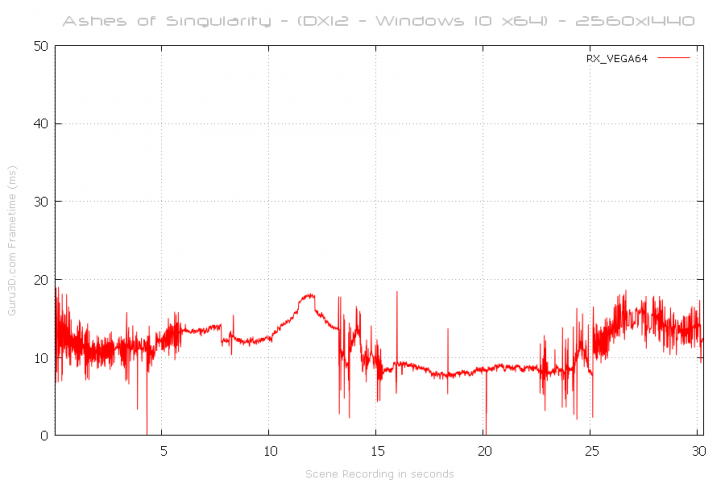
With this chart, lower = better. Huge spikes above 40 ms to 50 ms can be considered a problem like a stutter or indicate a low frame-rate. The RX Vega 64 definitely is battling something, but noting rather visual. We have seen this behaviour recently with the RX 480 and 580 as well.
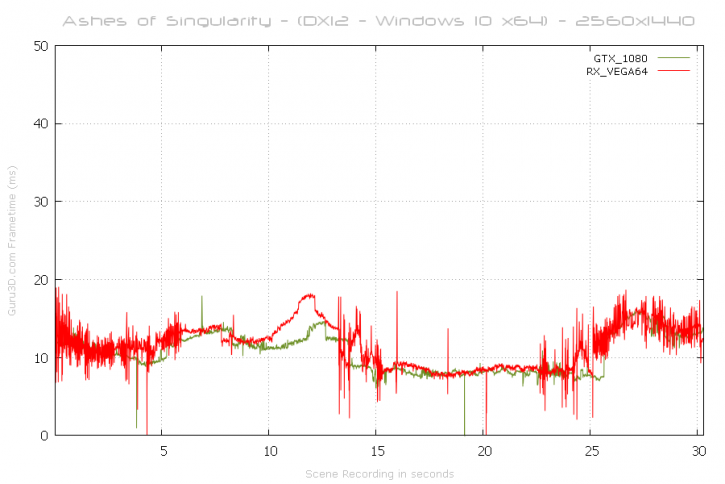
Though the cards perform well we see a tiny bit more inconsistency with the Vega 64, especially in the first and final 5 seconds of our recording there's a lot of stuff going on. Though in their defense, none of that is really visible on screen.
