DX12: FCAT Frame Experience Analysis Hitman 2016
Hitman 2016 Frame Experience Analysis
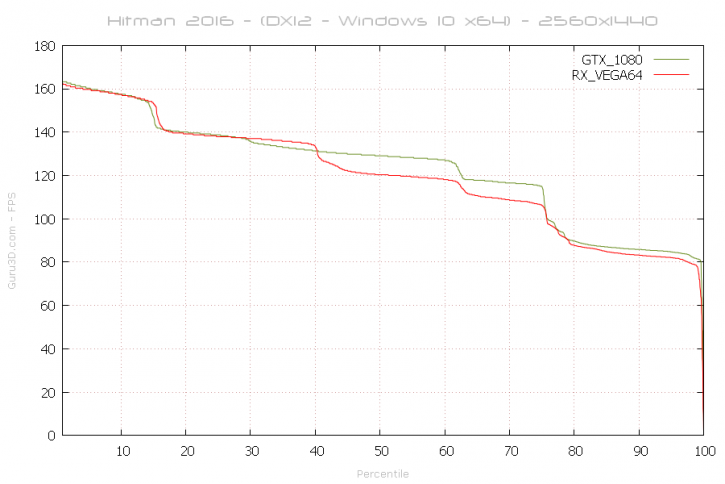
Above, the percentile chart of the 31 seconds gaming @ 2560x1440, this is the intro run of the integrated benchmark. Here we plot FPS and place it in relation to percentiles.
- Above 50% percentile of the time measured frames is the average framerate (higher = better).
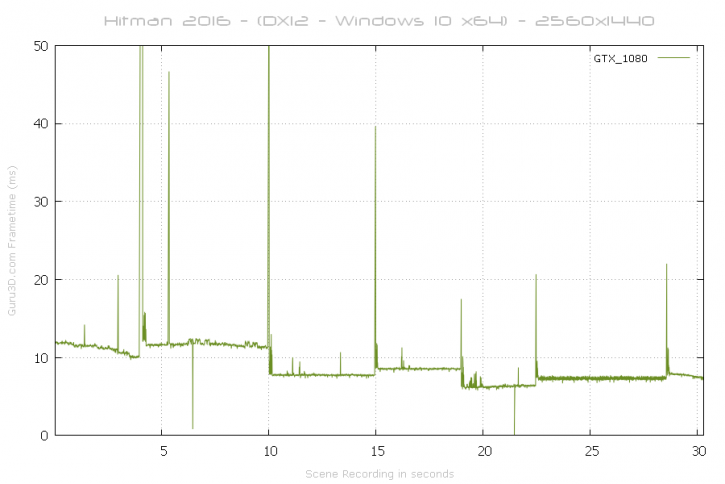
Once we move and plot the frame-time analysis, the stutters you see are apparant on all cards tested. These are real stutters from the game engine combined with scene changes in the benchmark.
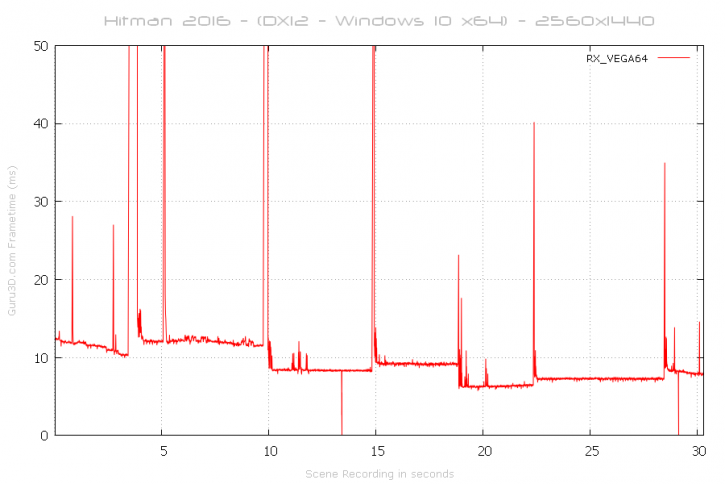
Each square step above is a scene change indicating a higher/lower framerate. For those that do not understand what you are looking at, the above is a game-time scene recorded for 31 seconds. With this chart, lower = better. Spikes above 40 ms to 50 ms can be considered a problem like a stutter or indicate a low framerate. This is Hitman with the DirectX 12 render path enabled.
Again, the massive spikes are scene changes mostly. Despite that looking dramatic, it's nothing worrying as this is game engine related.
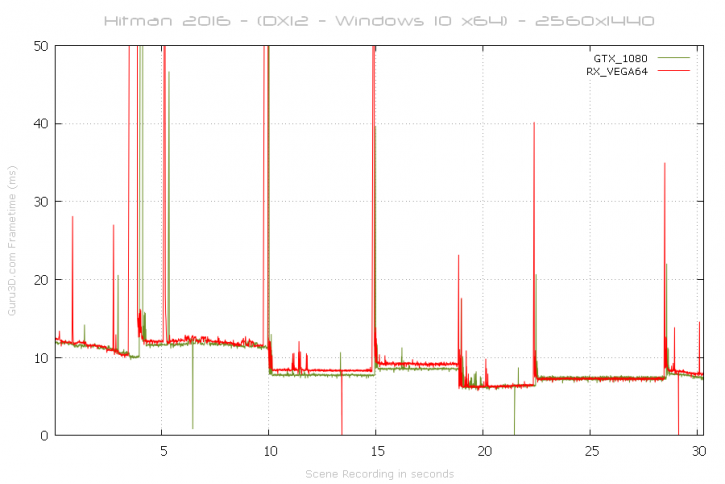
And combined the 31 seconds run. Hitman is continuously loading stuff in the background though, even during the benchmark run.
