DX12: FCAT Frame Experience Analysis Codemasters F1 2017
Codemasters F1 2017 DX11: Frame Experience Analysis
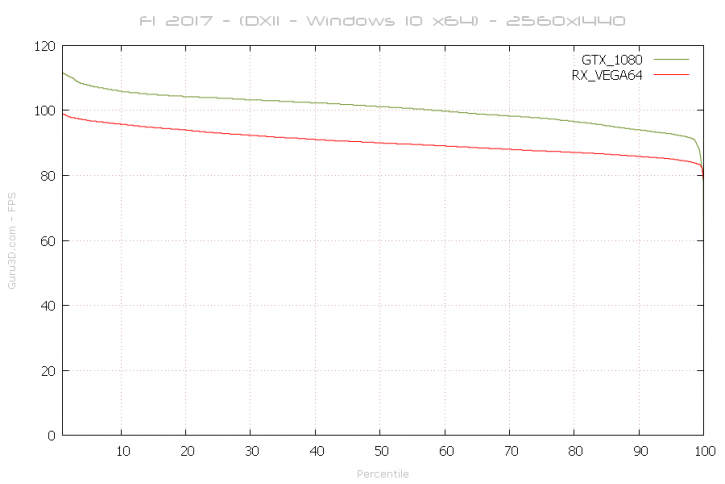
Above, the percentile chart of a 31 second recording @ 2560x1440. Here we plot FPS and place it in relation to percentiles. We do have DirectX 12 enabled again. 50% of the time measured frames is the average framerate (higher = better).
Aside from a but of rough start of the lap (racing game) we cannot see a significant enough glitch or stutter in frame-time scaling (chart wise) that is significant or long-lasting.
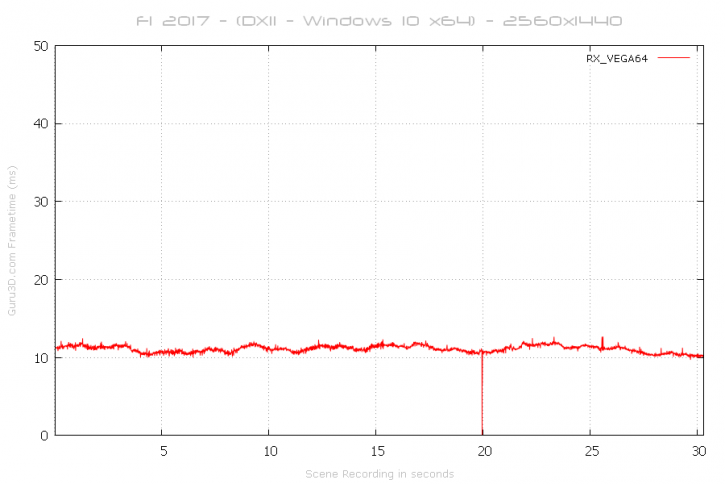
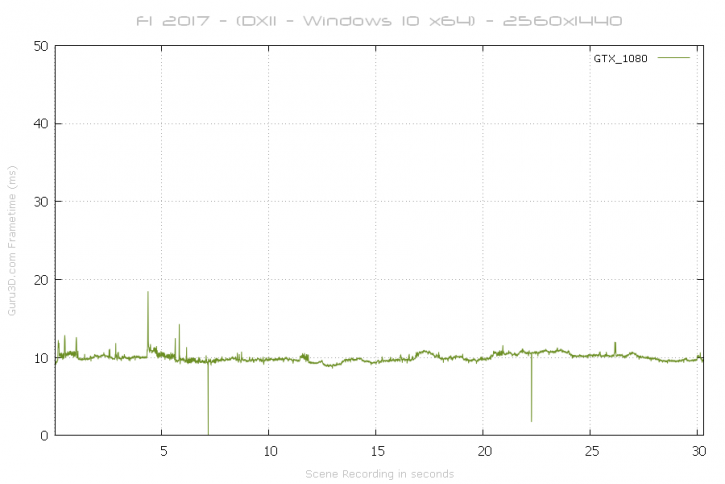
With this chart, lower = better. Huge spikes above 40 ms to 50 ms can be considered a problem like a stutter or indicate a low framerate. It's all good here.
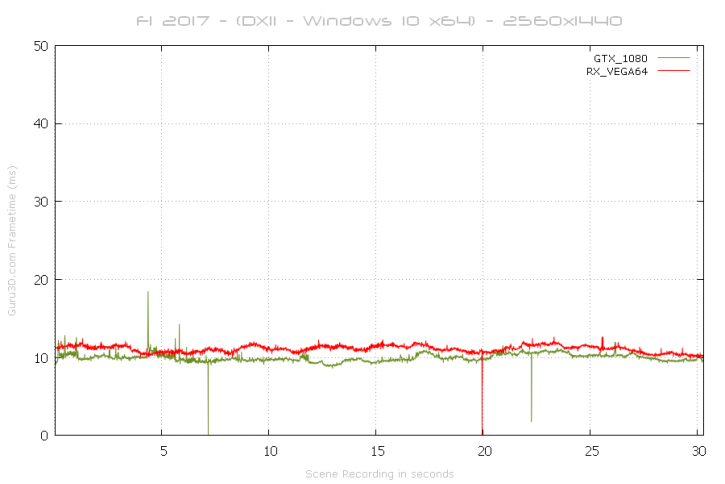
And combined, the cards both perform really well and very similar towards each other.
