.png)
Bang for buck
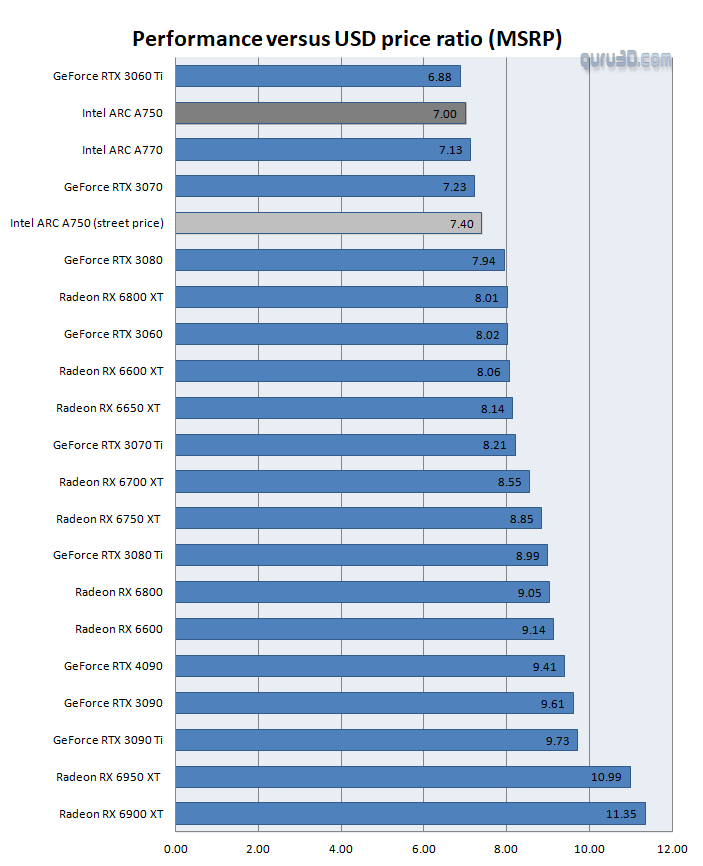
Performance per Dollar (based on MSRP)
This segment is handy if you want to check what product gets the most value for your money. We compare relative performance versus the US dollar MSRP. Lower is better in this chart; the MSRP in USD is divided by the average framerate of the product, so you are looking at USD per FPS rendered based on MSRP. Of course prices in stores can be very different and fluctuate quite a bit. As such these results are an indication.
And yes, the weak point of this chart is that we use MSRP when the prices currently are much higher. So we made a nuance here. in the USA these cards are now found. In the EU we see them at ~350~375 EUR), based on that price it positions like so: