
Game Frametime Analysis
Game Frametime Analysis GPU and CPU
The charts below show you graphics anomalies like stutters and glitches in a plotted chart: frame time and pacing measurements.
| Frame time in milliseconds |
FPS |
| 8.3 | 120 |
| 15 | 66 |
| 20 | 50 |
| 25 | 40 |
| 30 | 33 |
| 50 | 20 |
| 70 | 14 |
- FPS mostly measures performance, the number of frames rendered per passing second.
- Frametime AKA Frame Experience recordings mostly measure and expose anomalies - here, we look at how long it takes to render one frame. Measure that chronologically, and you can see anomalies like peaks and dips in a plotted chart, indicating something could be off.
We have a detailed article (read here) on the methodology behind it all. Basically, the time it takes to render one frame can be monitored and tagged with a number; this is latency. One frame can take, say, 17 ms. Higher latency can indicate a slow framerate, and weird latency spikes indicate a stutter, jitter, twitches; basically, anomalies that are visible on your monitor. These measurements show anomalies like small glitches and stutters that you can sometimes (and please do read that well, sometimes) see on screen. Below I'd like to run through a couple of titles with you. Bear in mind that Average FPS often matters more than frame time measurements.
Please understand that a lower frame time is a higher FPS, so for these charts, lower = better. Huge spikes would be stutters, thick lines would be bad frame pacing, and the graduate streamlining is framerate variation. As you might have observed, we're experimenting a bit with our charts and methodology. Below the game at Ultra HD, with image quality settings as used throughout this review.
For our test run, we'll fire off a 30-second scene at 3840x2160 pixels in both DX12 and DX12+Raytracing. We opt to use the Radeon RX 6800 XT paired and matched with the GeForce RTX 3080. The first being faster in DX12, the latter in DX12+Raytracing. So that should be an interesting observation.
We tested at the same MAX quality settings. The frame times and thus framerates on both cards are so good that we have lowered the visual scaler as low as 20ms, normally we plot at 40 or even 60ms here. Once visualize peaks at 40ms, you're in stutter territory. That's just not the case today.
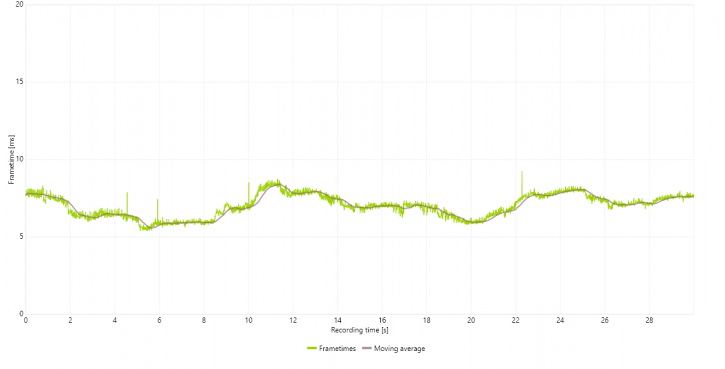
Above Radeon RX 6800 XT - DX12 (shading/rasterizer) performance
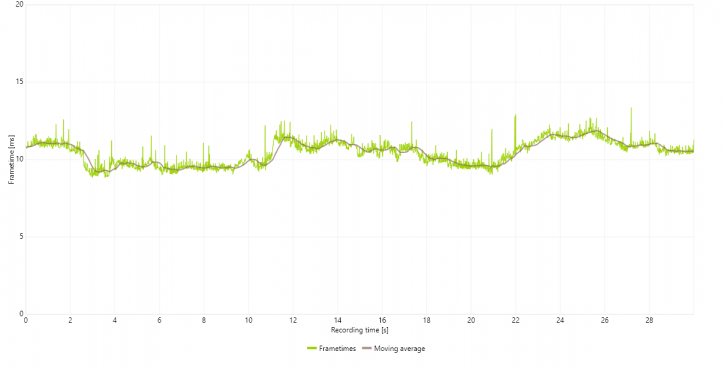
Above Radeon RX 6800 XT - DX12 (+raytracing) performance
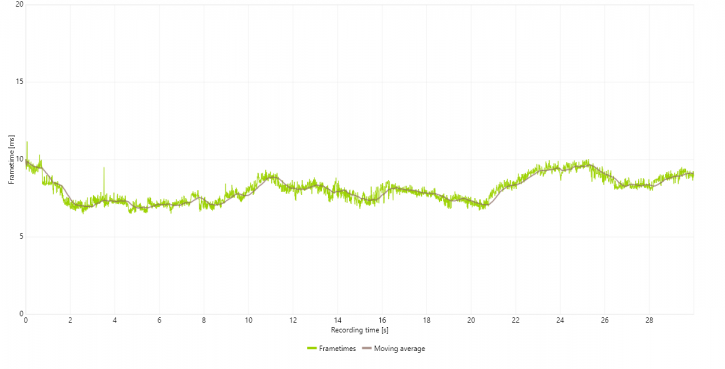
Above GeForce RTX 3080 - DX12 (shading/rasterizer) performance
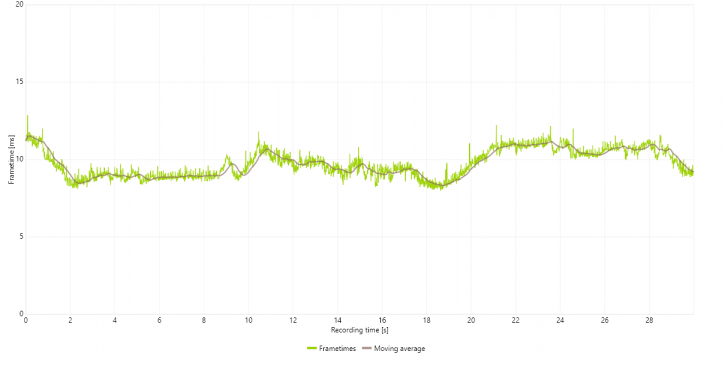
Above GeForce RTX 3080 - DX12 (+raytracing) performance
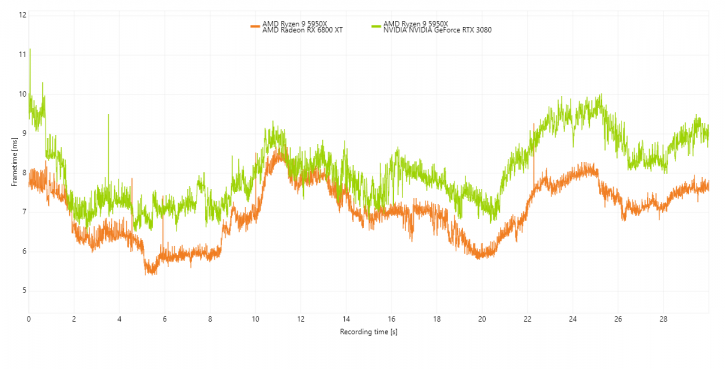
It's almost annoying to see how well both cards perform, so we'll close in even further at the highest measured frametime in ms, above DX12 frame times for 6800 XT (orange) and 3080 (green). You can see extremely similar frame pacing behavior, the green bar is positioned higher and thus slower (higher frame times - lower FPS). So you can tell that the 6800 XT is a notch faster.
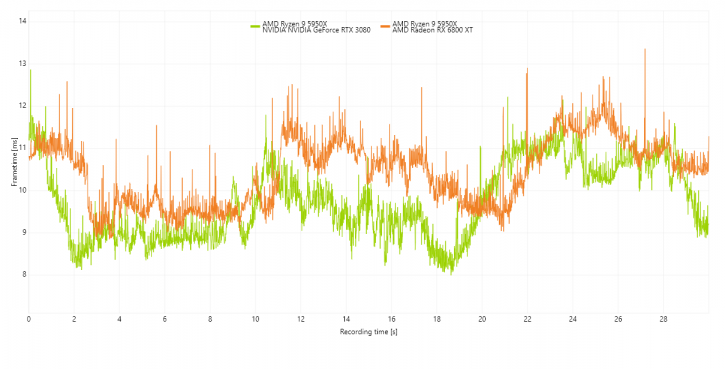
Once we flick on Raytracing the picture reverses like a paradoxical plot, the 3080 takes the lead and that makes sense as RTX 3000 offers better raytracing performance. But again very similar frame pacing overall. This is as good as things will get in a game, let me remind you that this plot is at a max of 13ms where we normally plot at 40 or 60ms.
