FCAT Frame Experience Analysis Tomb Raider
With a new benchmark technology called FCAT on the following three pages we will look into Frame Experience Analysis. Basically with the charts shown we are trying to show you graphics anomalies like stutters and glitches in a plotted chart. Lately there has been a new measurement introduced, latency measurements. Basically it is the opposite of FPS.
- FPS mostly measures performance, the number of frames rendered per passing second.
- Frametime aka Frame Experience recordings mostly measures and exposes anomalies - here we look at how long it takes to render one frame. Measure that chronologically and you can see anomalies like peaks and dips in a plotted chart, indicating something could be off.
| Frame time in milliseconds |
FPS |
| 8.3 | 120 |
| 15 | 66 |
| 20 | 50 |
| 25 | 40 |
| 30 | 33 |
| 50 | 20 |
| 70 | 14 |
We have a detailed article (read here) on the new FCAT methodology used, and it also explains whay we do not use FRAPS anymore.
Frametime - Basically the time it takes to render one frame can be monitored and tagged with a number, this is latency. One frame can take say 17ms. Higher latency can indicate a slow framerate, and weird latency spikes indicate a stutter, jitter, twitches basically anomalies that are visible on your monitor.
What do these measurements show?
But basically what these measurements show are anomalies like small glitches and stutters that you can sometimes (and please do read that well, sometimes) see on screen. Below I'd like to run through a couple of titles with you. Bear in mind that Average FPS matters more than frametime measurements. It's just an additional page or two of information that from now on we'll be serving you.
Tomb Raider Frame Experience Analysis
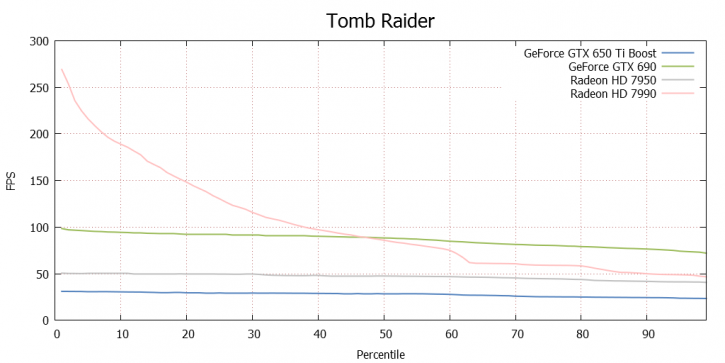
Above, a percentile chart of the 30 seconds @ 2560x1440. Here we plot FPS and place it in relation to percentiles.
- 50% of the time measured frames is doing 50 FPS.
- To the right you'll notice that the last 5% of the frames is at ~45 FPS or lower. This is another and valid way of looking at performance.
For comparative reasons and a little extra scaling in the charts we included a GeForce GTX 650 Ti Boost edition, Radeon 7950 Boost edition, GeForce GTX 690 and the Radeon HD 7990. As you guys know there are some "issues" and anomalies with AMDs multi-GPU solution, please read up on that here. This also explains really clearly why AMD has so many "fast" frames.
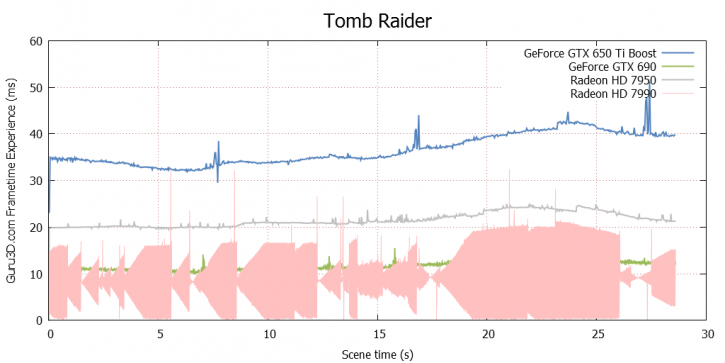
Above, the card at 2560x1440, but on this 30 second run the graphics card manages to remain roughly below roughly 20ms; as you can see. Realistically that's butter smooth. The thick frametime is the latency bouncing up and down, that's micro-stutter. However at this level it's so fast that you can't really see it.
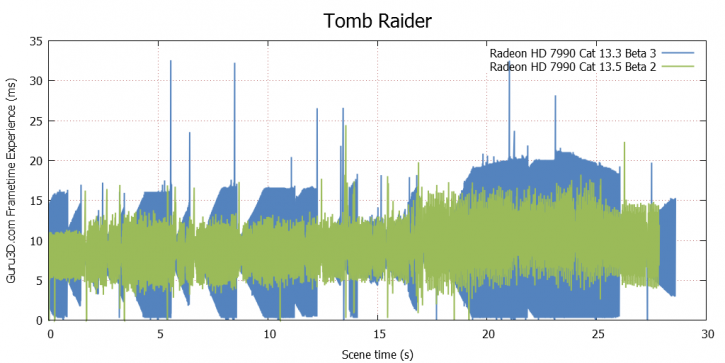
Good news though, AMD already released a Beta driver with frame-pacing optimizations towards press. We received it, unfortunately it is a biaaach to install as it would not detect the 2nd GPU. After two hours and a trick or two, we did get the 2nd GPU activated and it seems to be working for a handful of titles. As you can see above that's already looking much better.
Please keep in mind, that this is a prototype driver, a work-in-progress, in no shape or form representative of a final, end-user-ready software.
With this chart, lower = better. Huge spikes above 40 to 50ms can be considered a problem or indicate a low framerate. Despite what you see in the frametime chart, the the latency remains so low that the overall game experience it really nice.
