
FCAT Frametime analysis
Frametime and latency performance
With FCAT we will look into Frame Experience Analysis. Basically with the charts shown we are trying to show you graphics anomalies like stutters and glitches in a plotted chart. Lately there has been a new measurement introduced, latency measurements. Basically it is the opposite of FPS.
- FPS mostly measures performance, the number of frames rendered per passing second.
- Frametime AKA Frame Experience recordings mostly measures and exposes anomalies - here we look at how long it takes to render one frame. Measure that chronologically and you can see anomalies like peaks and dips in a plotted chart, indicating something could be off.
| Frame time in milliseconds |
FPS |
| 8.3 | 120 |
| 15 | 66 |
| 20 | 50 |
| 25 | 40 |
| 30 | 33 |
| 50 | 20 |
| 70 | 14 |
We have a detailed article (read here) on the new FCAT methodology used, and it also explains why we do not use FRAPS anymore. Frametime - Basically the time it takes to render one frame can be monitored and tagged with a number, this is latency. One frame can take say 17 ms. Higher latency can indicate a slow framerate, and weird latency spikes indicate a stutter, jitter, twitches; basically anomalies that are visible on your monitor.
What Do These Measurements Show?
What these measurements show are anomalies like small glitches and stutters that you can sometimes (and please do read that well, sometimes) see on screen. Below I'd like to run through a couple of titles with you. Bear in mind that Average FPS often matters more than frametime measurements.
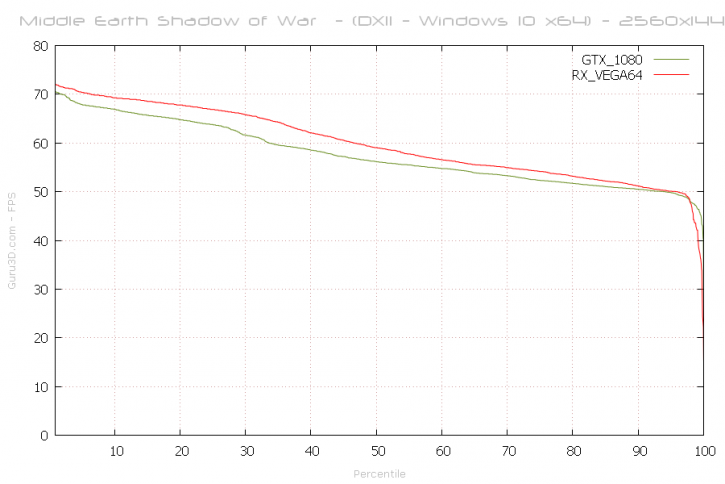
Above, the percentile chart of a 31 second recording @ 2560x1440. Here we plot FPS and place it in relation to percentiles. 50% of the time measured frames is the average framerate (higher = better). So in the first 31 seconds the Vega 64 is pushing almost 60 FPS and the GTX 1080 57'ish.
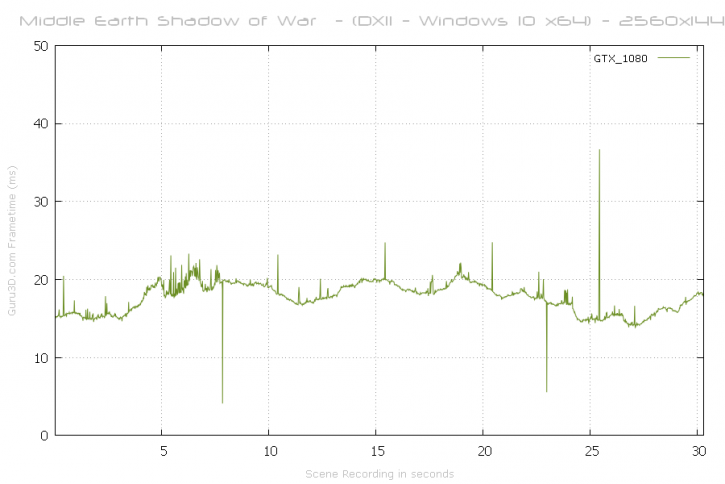
The benchmark sequence is a rough one, you will see a minor stutter here and there, especially when polygon rich objects come into play. We see a few frame drops and a full stutter nearing 40ms.
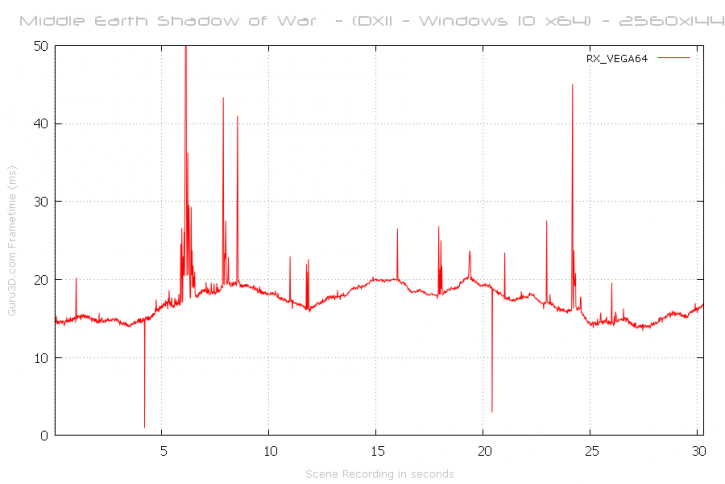
With this chart, lower = better. Huge spikes above 40 ms to 50 ms can be considered a problem like a stutter or indicate a low frame-rate. As you can see the Vega 64 card has a more hard time with the benchmark sequence, and that is visible on screen as you can see a couple of stutters. I noticed this with pretty much all Radeon cards visually on screen. It's a notch worse compared to the GTX 1080 alright, but nothing overly dramatic though.
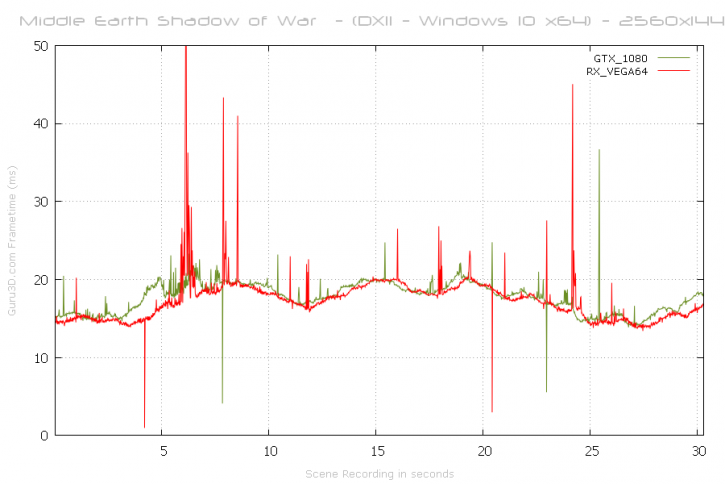
And combined, the cards both perform quite well overall, but the generic consensus is that they do exhibit a stutter here and there.
