
Game Frametime Analysis
Frametime and latency performance
The charts below show you graphics anomalies like stutters and glitches in a plotted chart: frame time and pacing measurements.
| Frame time in milliseconds |
FPS |
| 8.3 | 120 |
| 15 | 66 |
| 20 | 50 |
| 25 | 40 |
| 30 | 33 |
| 50 | 20 |
| 70 | 14 |
- FPS mostly measures performance, the number of frames rendered per passing second.
- Frametime AKA Frame Experience recordings mostly measure and expose anomalies - here, we look at how long it takes to render one frame. Measure that chronologically, and you can see anomalies like peaks and dips in a plotted chart, indicating something could be off.
We have a detailed article (read here) on the methodology behind it all. Basically, the time it takes to render one frame can be monitored and tagged with a number; this is latency. One frame can take, say, 17 ms. Higher latency can indicate a slow framerate, and weird latency spikes indicate a stutter, jitter, twitches; basically, anomalies that are visible on your monitor. These measurements show anomalies like small glitches and stutters that you can sometimes (and please do read that well, sometimes) see on screen. Below I'd like to run through a couple of titles with you. Bear in mind that Average FPS often matters more than frame time measurements.
Please understand that a lower frame time is a higher FPS, so for these charts, lower = better. Huge spikes would be stutters, thick lines would be bad frame pacing, and the graduate streamlining is framerate variation.
As you might have observed, we're experimenting a bit with our charts and methodology. Below the game at Ultra HD, with image quality settings as used throughout this review. Tested at ultra quality settings:
Note: we are playing around a bit and are adding more data. Our processor used is the Ryzen 9 5950X (16c/32t ZEN3).
- Green Frametime plot in ms
- Blue: GPU utilization plotted in percentage (0 to 100%)
- Orange: CPU utilization for the entire processor plotted in percentage (0 to 100%)
- Red: Highest thread CPU utilization in percentage (0 to 100%)
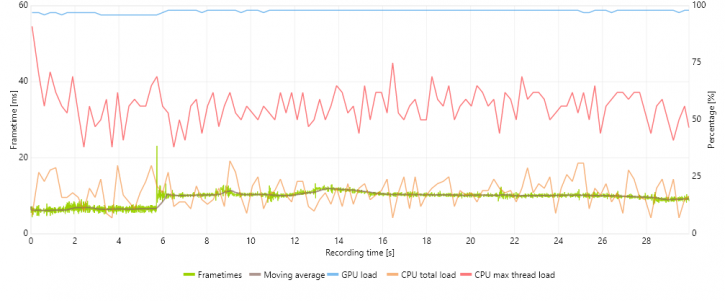
Above: GeForce RTX 3080
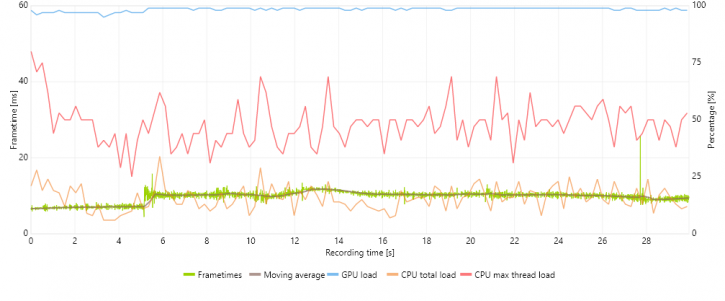
Above: Radeon RX 6800 XT
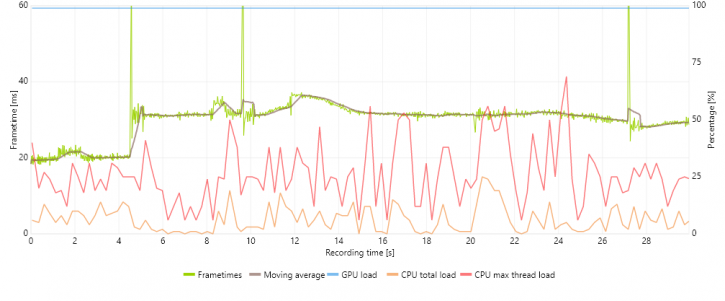
Above: GeForce 1660 SUPER (the green spikes are stutters during a scene change)
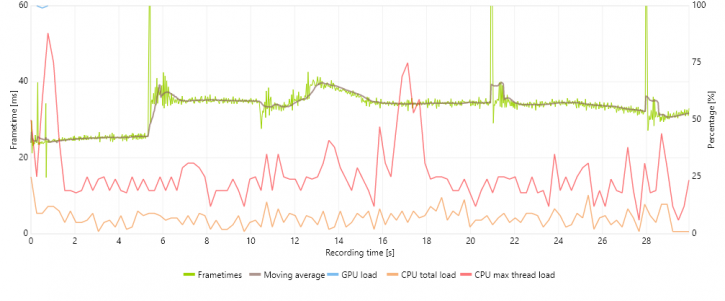
Above: Radeon RX 590 (the green spikes are stutters during a scene change)
