Page 7 - Load testing the PSU
Load testing the PSU
Fact is that we do not have the gear in house to be able to stress this PSU to it's full capacity or to measure ripple. We can connect everything we want, add more devices and overclock, but even then we'd normally peak at 500-550 Watts. The good thing in today's review; at this point with a 650 Watt PSU we are really stressing it.
So here's what we did. We took:
- eVGA Force 680i SLI mainboard (consumes heaps of current)
- Core 2 Quad Q6600 Processor (overclocked to 3 GHz)
- 2x GeForce 8800 GTX cards setup in SLI (624c - 1147m)
- Watercooling
So to stress a little more we overclocked the CPU cores towards 3.0 GHz, had the DDR2 memory running at 1147 MHz and the two GeForce 8800 GTX cards toward 625 MHz on the core and 2100 MHz for its memory.
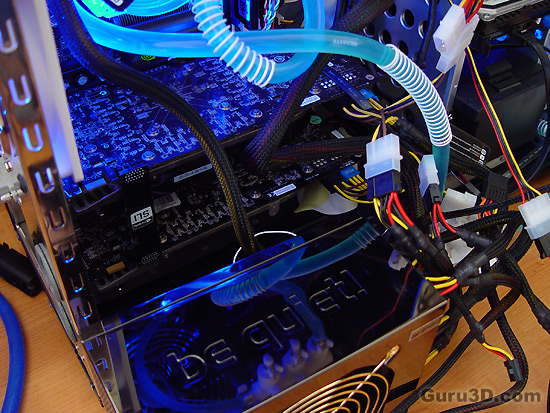 Organized chaos people ... organized chaos.
So here's where we start a selection of gaming tests well balanced for optimal CPU (multi-core) and GPU (SLI) performance. Now we monitor voltage load differences/behavior. I mention this method all the time in our PSU reviews, let me show you some examples on how we achieve these numbers.
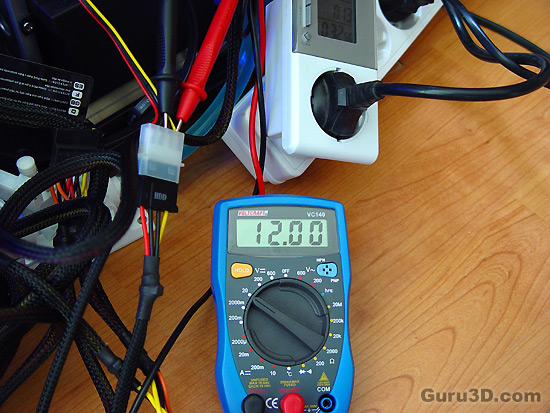
We take a multimeter and tap critical points during system under load and when in idle. We then observe the fluctuation. Here we see the 12V2 rail on an idle system .. (the optical and HDD rails). A perfect Voltage.
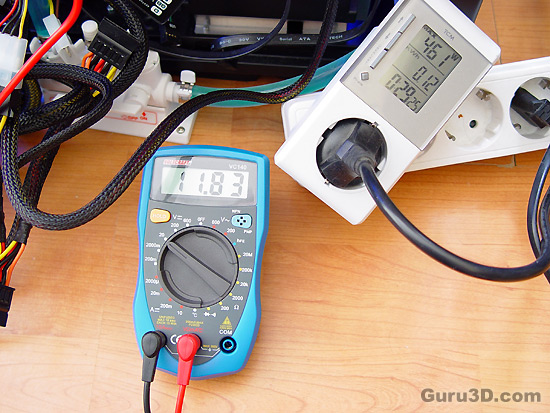
Here we made a bypass on the 12V3 line (PCIe) and under 100% load we see a voltage of 11.83 Volts.
So we monitored the primary voltages in both IDLE and LOAD (fully utilized) modes. We noted down the lowest and highest value we see and that is the fluctuation. If a PSU is unstable we'd see much more fluctuation, differences and discrepancies which can result in system instability.
Once we gathered all results we can place them in an easy to understand chart.
Look at the animation, the two lines show both the idle or Load state of a specific voltage rail, the grey one the lowest voltage dip measured, the blue one the highest fluctuation. That's your fluctuation delta.
