Right mark Audio Analyzer
Right mark Audio Analyzer
RMAA has become a staple in audio reviews and in past reviews many would use a loop-back test to provide the results. However, many times this method can provide incorrect results as the ADC on the given card influences the results and if the cards playback section surpasses the recording section the results will be limited and will not show the accurate abilities of the card.
Auzentech supplied a large amount of official testing data for both headphones and speakers outputs, below is a small compilation of those results. To get the most accurate results, the Bravura 7.1 was connected to a high end recording card with an ADC which can properly illustrate what the card has to offer. Usually we would prefer to use our own results but we had no recording card on hand that could accurately measure both the speaker out and the headphone out which needs to be loaded. While these results were supplied by the manufacturers they are reasonable and well within the approximate results we would expect to see given the hardware components on this card. For those interested, we are actually procuring a high end ADC unit for future soundcard testing using RMAA and other measurement software.
Frequency Response
This graph shows the output signal characteristics of the Auzentech Bravura 7.1. The more linear the graphed line is the more transparent and neutral the cards audio output is. Variances in the graph would produce coloration in that particular frequency range producing output higher or lower than the remaining frequencies. The Bravura 7.1 produced excellent frequency response results.
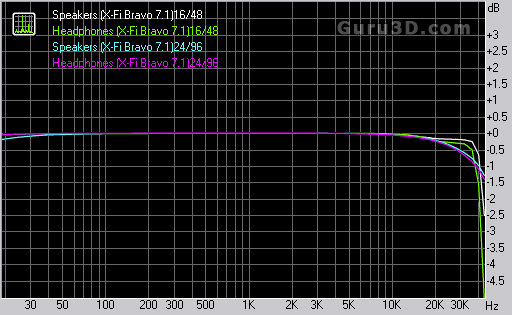
Notes on above Graph: We have noticed that RMAA has difficulty with scaling on the frequency axis when graphing multiple bit/depths and sample rates. The results are accurate when viewed on their own but the axis scaling is incorrect when comparing one to the others. We have contacted the RMAA authors in hopes they can shed some light on this and possible resolve the issue.
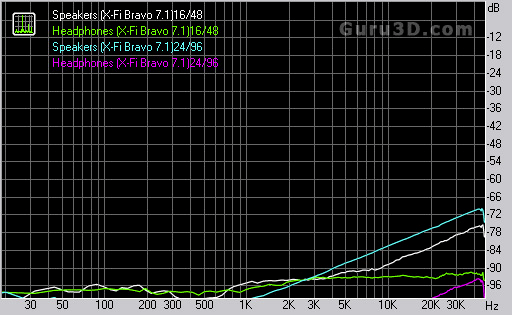
Noise Level
The above graph shows the level of noise present in the cards output signal. There will always be some level of noise present in any audio device but in many cases the level is so low that it is not audible to the human ear. The Bravura 7.1 produced excellent noise measurements across the tested ranges.
Dynamic Range
This graph shows the card's operating range and the graphs illustrate the lowest and highest range the card is capable of producing accurately. The Bravura 7.1 shows an excellent dynamic range across the tested ranges.
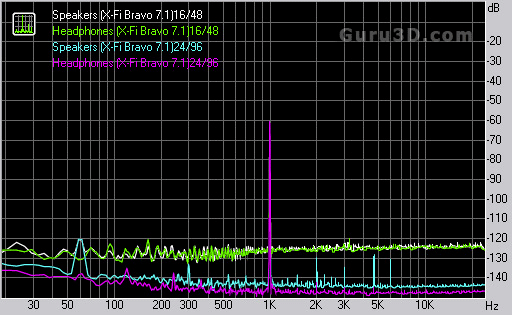
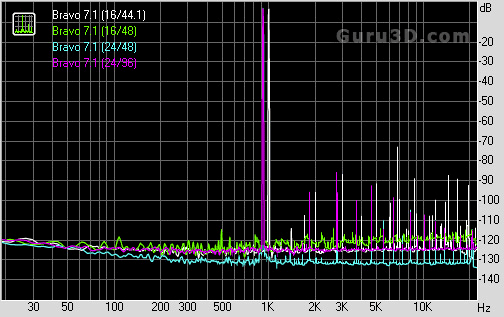
THD + Noise (at -3 dB FS)
This measurement indicates how much Total Harmonic Distortion and Noise is present in the cards output signal. Harmonic distortion presents itself as multiple odd and/or even harmonic overtones in the original signal. The lower the measurement the better and the Bravura 7.1 produced excellent THD+N measurements across the test set.
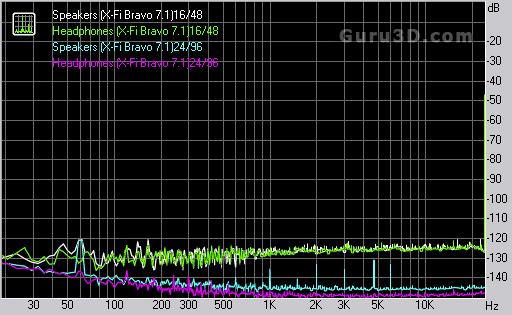
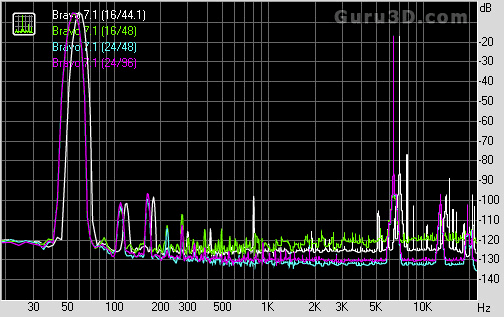
Intermodulation Distortion
This graph shows the measurement of IMD. This type of distortion results from multiple signals being mixed together and producing distortion in the form of overtones that are not harmonically linked to any of the base signals. Lower measurements are definitely preferred for any type of distortion measurements. The lower the measurement the better and the Bravura 7.1 produced excellent results through the test sets.
Stereo Crosstalk
This graph is a measurement of the bleed-through effect from one stereo channel to the other. The lower the measured crosstalk values are the less bleed through. In our test set the Bravura 7.1 produced excellent results. Indeed 24/96 for headphone output is almost off the scale, we would have liked to seen this output at 24/192Khz.