VRM Area Thermals and CPU Temperatures
VRM Area Thermals
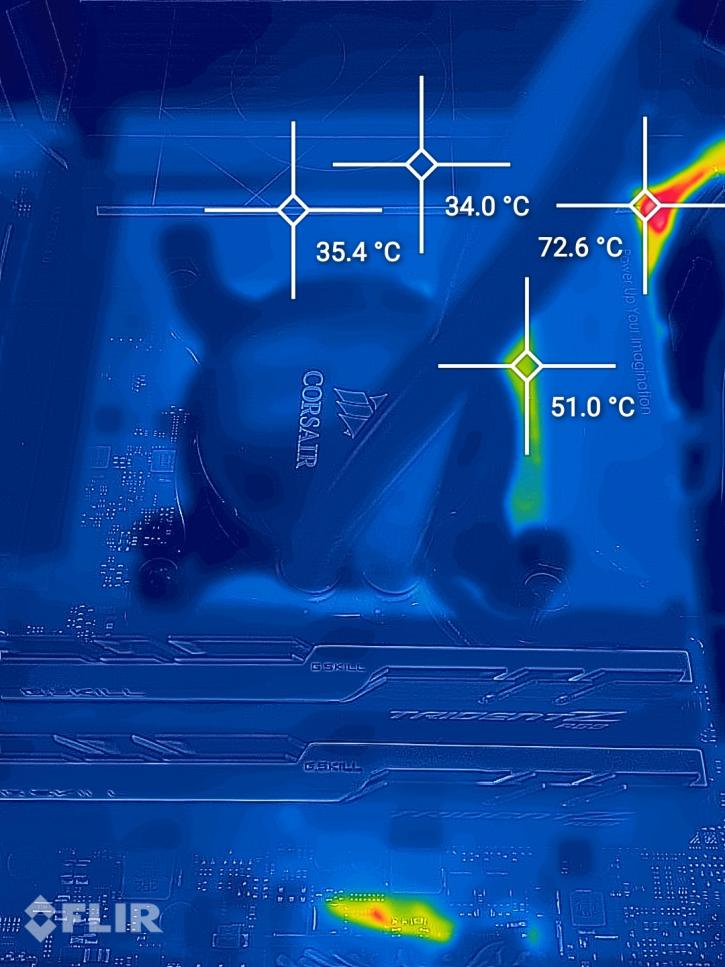
Lately, it has been requested if we could list VRM temperatures. We could hook into sensors and start measuring. Now a good way really is to look at the VRM area with a thermal camera. This way you can detect hot-spots and/or worrying stuff. We run the FPU and CPU torture test in AIDA. The chart plot shows the maximum VRM temperature measured at thermal sensor level. The VRM temperatures you see listed in the chart are not based upon the thermal image, but the max temp reported by the thermal sensors at the VRM stages.
The thermal image is there for visualization of heat bleed, not measurement as most part of the VRM is covered by heatsinks.
- System setup: normal conditions / default settings
- We stat AIDA FPU Stress test, leave it running for 15 minutes, and note down the highest temperature measured on VRM sensors. If there are two VRM loops, we note down the hottest measured temperature.
With these power stages, heat cannot be an issue.
Temperatures
The reason we do not table up temperature results is that we'd need to apply identical cooling over and over on all platforms. Also, coolers (RPM) react differently to TDP and variables like BIOS on all motherboards let alone brands. The processor peaks towards 50 Degrees C under full load on the processor package, this temperature is measured during a looped Prime95 1024M runs. We use a 240mm LCS.
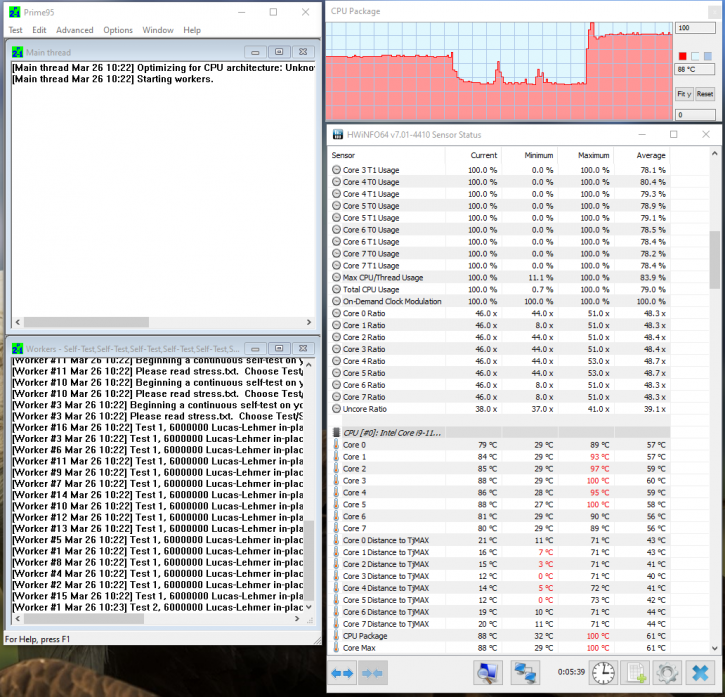
Above: Prime 95 Smallest FFT (representable as a torture all-core generic CPU load stressing cores, L1 and L2, AVX).
