Testing Regimen - Right Mark Audio Analyzer
Testing Regimen - Right Mark Audio Analyzer
Frequency Response
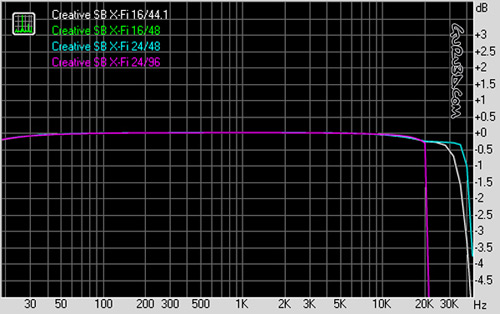
This graph shows the output signal characteristics of the Titanium HD. The more linear the graphed line is the more transparent and neutral the cards audio output is. Variances in the graph would produce coloration in that particular frequency range producing output higher or lower than the remaining frequencies. The Titanium HD produced excellent frequency response results.
Notes on above Graph: We have noticed that RMAA has difficulty with scaling on the frequency axis when graphing multiple bit/depths and sample rates. The results are accurate when viewed on their own but the axis scaling is incorrect when comparing one to the others. We have contacted the RMAA authors and hopefully it will be fixed in upcoming revisions of this application.
Noise Level
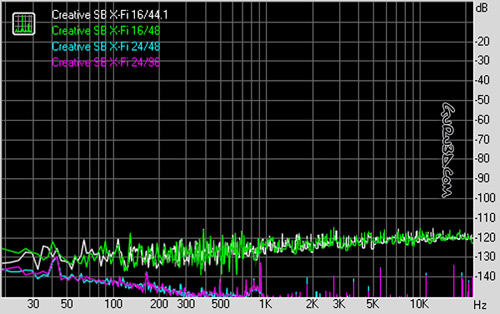
The above graph shows the level of noise present in the cards output signal. There will always be some level of noise present in any audio device but in many cases the level is so low that it is not audible to the human ear. Titanium HD produced excellent noise measurements across the tested ranges.
Dynamic Range
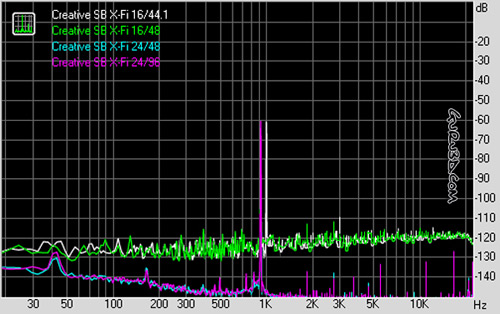
This graph shows the card's operating range and the graphs illustrate the lowest and highest range the card is capable of producing accurately. The Titanium HD shows an excellent dynamic range across the tested ranges.
