Testing & Results
Testing & Results
As said in the introduction, it's going to be nearly impossible to stress these beasts with the hardware I currently have available to me. The Dual-core Opteron/X1800 setup will show any obvious weakness in a lower quality or lower power PSU but will not really strain these Zippy PSUs unless they're faulty (which they're not). Test results are of course mandatory in any review though, so below you can see our results which has been overclocked to push the PSU's harder.
Hardware used:
- Opteron 165 (Dual Core) @ 2.7GHz
- DFI LanParty UT nF4 Ultra-D
- 2GB G.Skill HZ PC4000
- HIS X1800XT 512MB
- X-Fi Xtreme Music
- 250GB Samsung IDE
- 80GB WD IDE
- NEC 3520A
Readings were taken with a digital multimetre. Full load consisted of two instances of Prime95 (one for each core) and looping 3dmark05.
Note: ATX standards state you are allowed a 5% tolerance either way, so for example the 12v rail can vary between 11.4v & 12.6v and be classed as in spec, but you do want as little fluctuation as possible or instability could occur.
500w load results:
| Rail | Load Low | Load High |
|
+12v |
12.01 |
12.03 |
|
+5v |
5.01 |
5.02 |
|
+3.3v |
3.3 |
3.3 |
Below you will find three attractive looking graphs which were generated using OCCT's built in test. These graphs show the rails on the PSU. What you'll notice though is that the figures on the graph differ from the figures in the table above. The figures in the table were taken using a digital multimetre, the figures in the graphs below were taken using the motherboard sensors. I've included these purely because this is a great example of how inaccurate motherboard sensors are and why everyone should invest in a half decent DMM if they want to check their rails reliably.
Do not confuse the graphs with the actual results, which are in the above table.
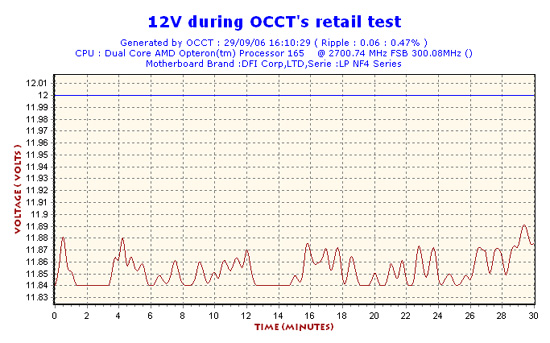
The 12v rail as claimed by the motherboard sensors.
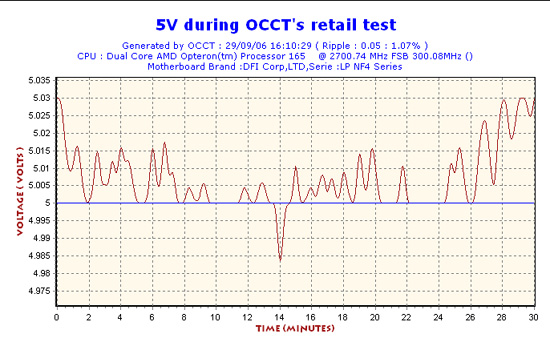
The 5v. The blue line going across the graph is the reference line.
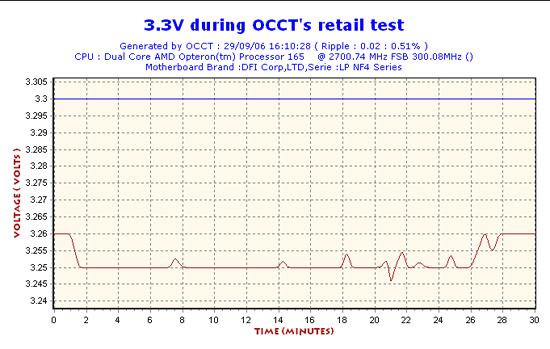
The 3.3v. The red line indicates the PSUs rails as measured by the inaccurate motherboard sensors. See the table for the actual results.
720w load results:
| Rail | Load Low | Load High |
|
+12v |
12.00 |
12.01 |
|
+5v |
5.01 |
5.02 |
|
+3.3v |
3.3 |
3.31 |
You get the idea about the sensors... I don't think there is a need to include another three graphs for the other model of Zippy.
All that's really needed to be understood by the above figures is that both these PSUs handled the test system absolutely flawlessly, as they should. We pushed, tried yet you can't really stress the PSUs really badly. We need dual GeForce 8800 and quad cores to do this ! What a luxury issue huh ?
Anyway, let's move on to the verdict.
