FCAT 3840x2160 - Tomb Raider
Frame Capture Analysis Tool
With FCAT on the following pages we will look into Frame Experience Analysis.
Basically with the charts shown we are trying to show you graphics anomalies like stutters and glitches in a plotted chart. Lately there has been a new measurement introduced, latency measurements. Basically it is the opposite of FPS.
- FPS mostly measures performance, the number of frames rendered per passing second.
- Frametime aka Frame Experience recordings mostly measures and exposes anomalies - here we look at how long it takes to render one frame. Measure that chronologically and you can see anomalies like peaks and dips in a plotted chart, indicating something could be off.
| Frame time in milliseconds |
FPS |
| 8.3 | 120 |
| 15 | 66 |
| 20 | 50 |
| 25 | 40 |
| 30 | 33 |
| 50 | 20 |
| 70 | 14 |
We have a detailed article (read here) on the FCAT methodology used, and it also explains why we do not use FRAPS anymore.
Frametime - Basically the time it takes to render one frame can be monitored and tagged with a number, this is latency. One frame can take say 17ms. Higher latency can indicate a slow framerate, and weird latency spikes indicate a stutter, jitter, twitches basically anomalies that are visible on your monitor.
What Do These Measurements Show?
Basically what these measurements show are anomalies like small glitches, freezes, scene changes and stutters that you can sometimes (and please do read that well, sometimes) see on screen. Below I like to run through a couple of titles with you. Mind you that Average FPS matters more than frametime measurements. It's just an additional page or two of information that from now on we'll be serving you.
Tomb Raider Frame Experience Analysis
Note, for FCAT we'll use the GeForce GTX 780 mainly. It seems to be a nice match price/performance wise. But in multi-GPU setups it also offers other advantages I will expllain later.
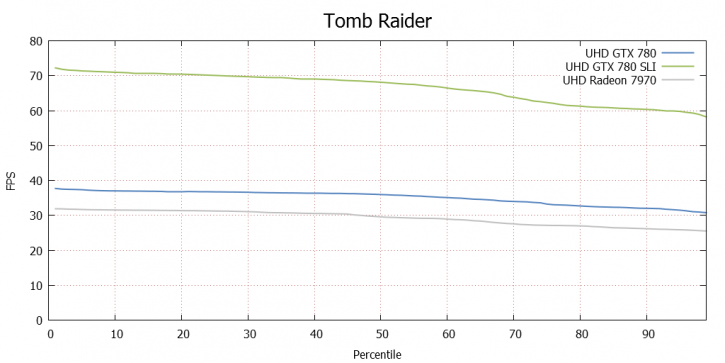
Above a percentile chart of the 30 seconds @ 3840x2160. Here we plot FPS and place it in relation to percentiles.
- A single Radeon HD 7970 GHz 50% of the time measured frames is doing 30 FPS.
- A single GeForce GTX 780 50% of the time measured frames is doing 36 FPS.
- A single GeForce GTX 780 50% of the time measured frames is doing 68 FPS.
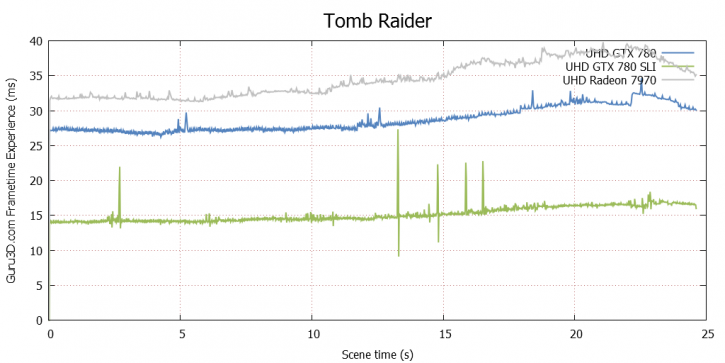
And the more important charts then, the frametime experience. In green we see GTX 780 SLI - a few minor glitches, nothing you'd notice or see though. Then the single GTX 780 and all the way up - top is the Radeon HD 7970 GHz edition. With this chart, lower = better. Huge spikes above 40-50ms can be considered a problem or indicate a low framerate (look at the table at the top of this screen).
We'll also show some Crossfire numbers later on.
