FCAT Frame Experience Analysis Tomb Raider
With a new benchmark technology called FCAT on the following few pages, we will look into Frame Experience Analysis. Basically with the charts shown we are trying to show you graphics anomalies like stutters and glitches in a plotted chart. Lately there has been a new measurement introduced, latency measurements. Basically it is the opposite of FPS.
- FPS mostly measures performance, the number of frames rendered per passing second.
- Frametime AKA Frame Experience recordings mostly measures and exposes anomalies - here we look at how long it takes to render one frame. Measure that chronologically and you can see anomalies like peaks and dips in a plotted chart, indicating something could be off.
| Frame time in milliseconds |
FPS |
| 8.3 | 120 |
| 15 | 66 |
| 20 | 50 |
| 25 | 40 |
| 30 | 33 |
| 50 | 20 |
| 70 | 14 |
We have a detailed article (read here) on the new FCAT methodology used, and it also explains whay we do not use FRAPS anymore.
Frametime - Basically the time it takes to render one frame can be monitored and tagged with a number, this is latency. One frame can take say 17ms. Higher latency can indicate a slow framerate, and weird latency spikes indicate a stutter, jitter, twitches basically anomalies that are visible on your monitor.
What Do These Measurements Show?
Basically, what these measurements show are anomalies like small glitches and stutters that you can sometimes (and please do read that well, sometimes) be seen on screen. Below I'd like to run through a couple of titles with you. Bear in mind that Average FPS matters more than frametime measurements. It's just an additional page or two of information that from now on we'll be serving you.
Tomb Raider Frame Experience Analysis
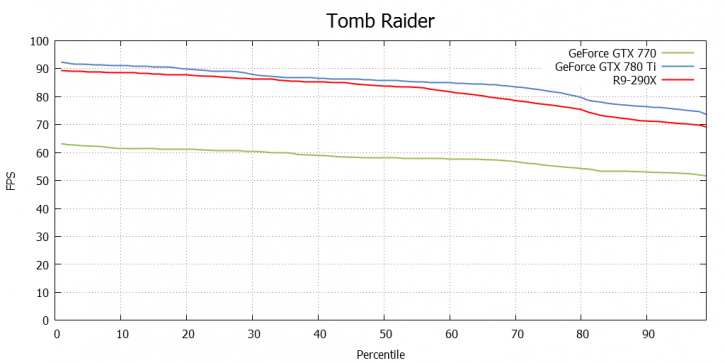
Above, a percentile chart of the 30 seconds @ 2560x1440. In this particular chart we plot FPS and place it in relation to percentiles.
- For today's tested card 50% of the time measured frames is close to 90 FPS. This you can consider the averages framerate.
For comparative reasons and a little extra scaling in the charts we included the Radeon R9 290X and the a GeForce 770.
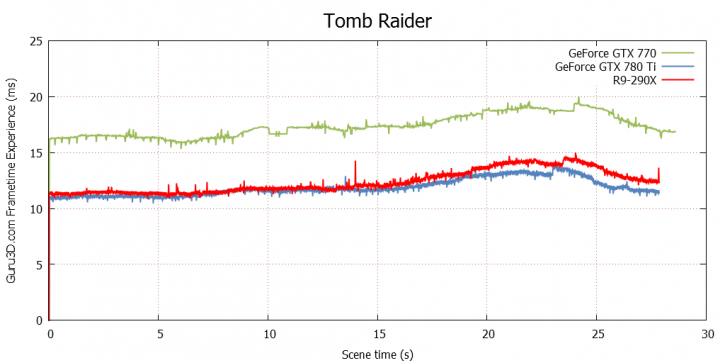
Above, the card at 2560x1440. You'll notice that here frametime scaling (chart wise) still needs to be altered, the charts are incredibly blown up, but on this 30 second run the graphics card manages to remain roughly below 25ms; as you can see there are no real stutters recorded. This perfect rendering for all cards (frametime wise lower is better).
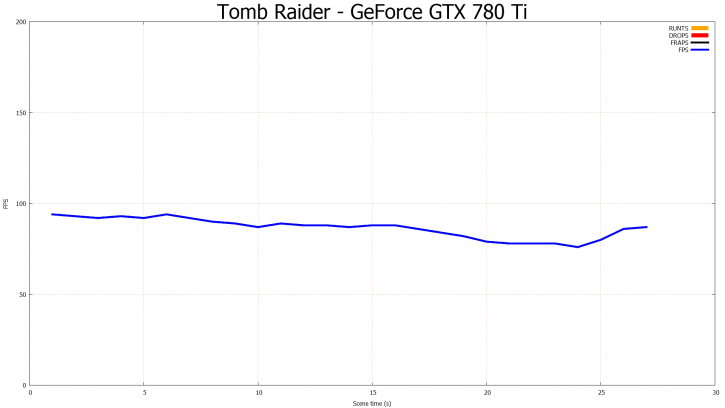
And here the FPS plot for today's tested card, recorded for 28 seconds in the timedemo. We are way above 60 FPS on average, sweet!
