DX12: FCAT Frame Experience Analysis - Rise Of The Tomb Raider
With a benchmark technology called FCAT on the following few pages, we will look into Frame Experience Analysis. With the charts shown, we are trying to show you graphics anomalies like stutters and glitches in a plotted chart. Lately, there has been a new measurement introduced, latency measurement. Basically, it is the opposite of FPS.
- FPS mostly measures performance, the number of frames rendered per passing second.
- Frametime AKA Frame Experience recordings mostly measures and exposes anomalies - here we look at how long it takes to render one frame. Measure that chronologically and you can see anomalies like peaks and dips in a plotted chart, indicating something could be off.
| Frame time in milliseconds |
FPS |
| 8.3 | 120 |
| 15 | 66 |
| 20 | 50 |
| 25 | 40 |
| 30 | 33 |
| 50 | 20 |
| 70 | 14 |
We have a detailed article (read here) on the new FCAT methodology used, and it also explains why we do not use FRAPS anymore.
Frametime - Basically the time it takes to render one frame can be monitored and tagged with a number, this is latency. One frame can take, say, 17 ms. Higher latency can indicate a slow frame-rate, and weird latency spikes indicate a stutter, jitter, twitches; basically, anomalies that are visible on your monitor.
What Do These Measurements Show?
Basically, what these measurements show are anomalies like small glitches and stutters that you can sometimes (and please do read that well, sometimes) see on-screen. Below, I'd like to run through a couple of titles with you. Keep in mind that average FPS matters more than frametime measurements.
Rise of the Tomb Raider Frame Experience Analysis
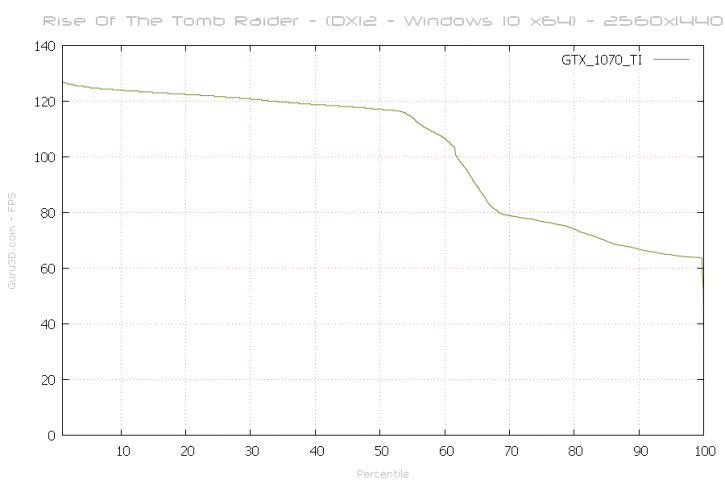
Above, a percentile chart of the first 31 seconds @ 2560x1440 of the benchmark recorded. In this particular chart, we plot FPS and place it in relation to percentiles.
- If you look at the X axis at 50%, that is for 50% of the time measured frames are close to 117 FPS in the first segment of the benchmark. This you can consider the average frame rate (this is the intro scene where Lara walks over the snowy mountain).
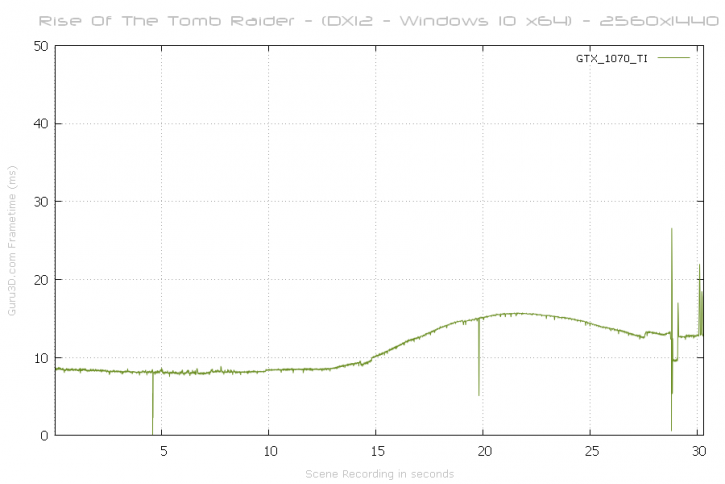
Now we move to latency measurements (frame-times). Above, the card at 2560x1440. On this 31 second run, the graphics card manages extremely well. This is actually pretty perfect rendering (frame-time wise lower is better). At the end what you see is a scene change, it is not an anomaly. Now let's add a GTX 1080 to the graph.
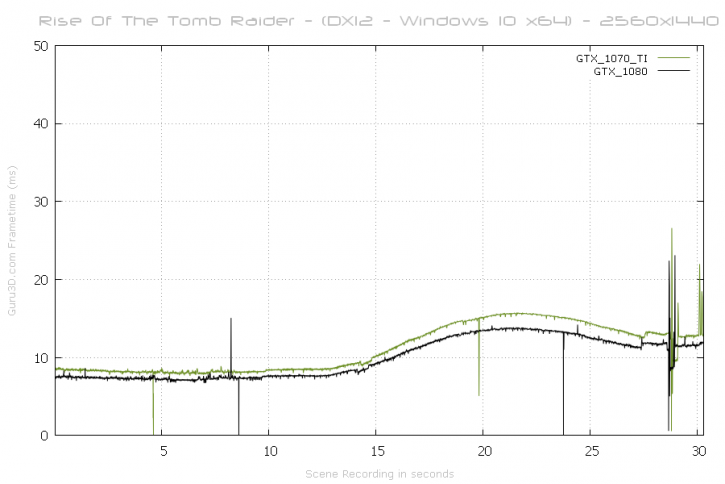
So, on each benchmark page, I will add one extra FCAT result, in here you can see the GeForce GTX 1080 and GeForce GTX 1070 Ti, just a little extra for comparison's sake.
