
Game Frametime Analysis GPU and CPU
Game Frametime Analysis GPU and CPU
The charts below show you graphics anomalies like stutters and glitches in a plotted chart: frame time and pacing measurements.
| Frame time in milliseconds |
FPS |
| 8.3 | 120 |
| 15 | 66 |
| 20 | 50 |
| 25 | 40 |
| 30 | 33 |
| 50 | 20 |
| 70 | 14 |
- FPS mostly measures performance, the number of frames rendered per passing second.
- Frametime AKA Frame Experience recordings mostly measure and expose anomalies - here, we look at how long it takes to render one frame. Measure that chronologically, and you can see anomalies like peaks and dips in a plotted chart, indicating something could be off.
We have a detailed article (read here) on the methodology behind it all. Basically, the time it takes to render one frame can be monitored and tagged with a number; this is latency. One frame can take, say, 17 ms. Higher latency can indicate a slow framerate, and weird latency spikes indicate a stutter, jitter, twitches; basically, anomalies that are visible on your monitor. These measurements show anomalies like small glitches and stutters that you can sometimes (and please do read that well, sometimes) see on screen. Below I'd like to run through a couple of titles with you. Bear in mind that Average FPS often matters more than frame time measurements.
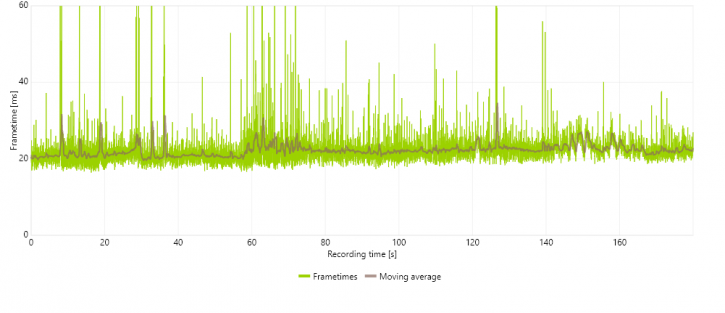
Please understand that a lower frame time is a higher FPS, so for these charts, lower = better. Huge spikes would be stutters, thick lines would be bad frame pacing, and the graduate streamlining is framerate variation. As you might have observed, we're experimenting a bit with our charts and methodology. Below the game at Ultra HD, with image quality settings as used throughout this review. Tested at ultra quality settings:
Note: we are playing around a bit and are adding more data. Our processor used is the Ryzen 9 5950X (16c/32t ZEN3).
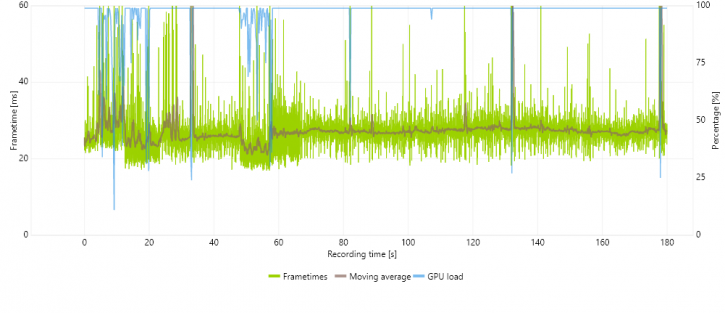
GeForce RTX 3090
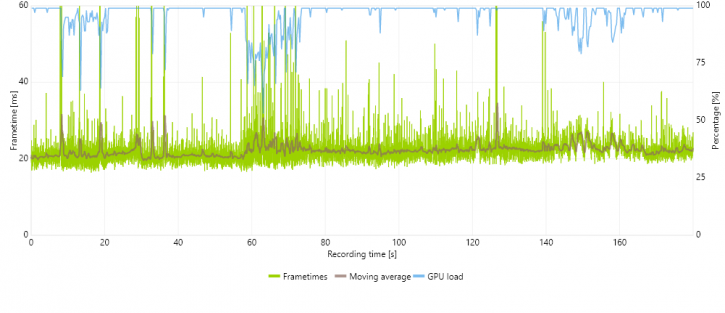
Above the same card and same plot, but now we add GPU utilization (blue). Surprisingly a lot of the time, the GPU is, however, fully utilized quite a lot.
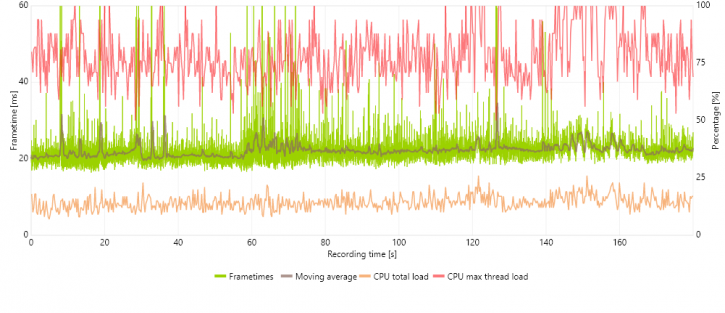
Above, still the same RTX 3090. We now add CPU utilization in total for all sixteen cores (brown) and max tread utilization load in red. Now, if you look at that red line, it's becoming more and more clear that the sim likes single threads as fastly clocked as possible. Where it breaches the 100% marker, it even runs out of stamina. If you look at the brown line, that's your total CPU utilization overall, and yeah, that indicates the sim is not threading very well. Ideally, the red and brown lines are close to each other.
Radeon RX 6900 XT
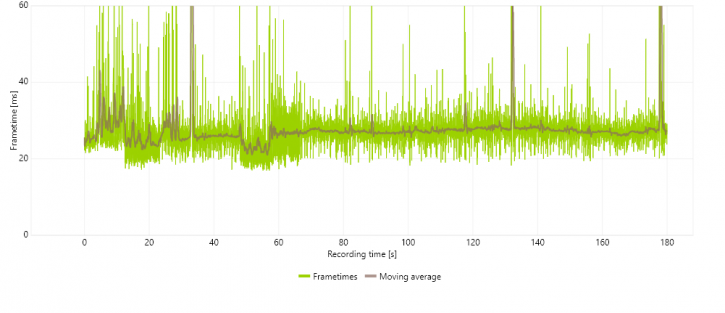
Once we take the Radeon RX 6900 XT, we see a similar frametime and pacing behavior pattern. You can argue, though, that it is even a notch worse than the 3090. We see a lot of frame pacing and stutters.
Above in blue, we add GPU utilization. Again a similar pattern indicating that GPU load is pretty well utilized. Indicating that the graphics card is full throttle at work.
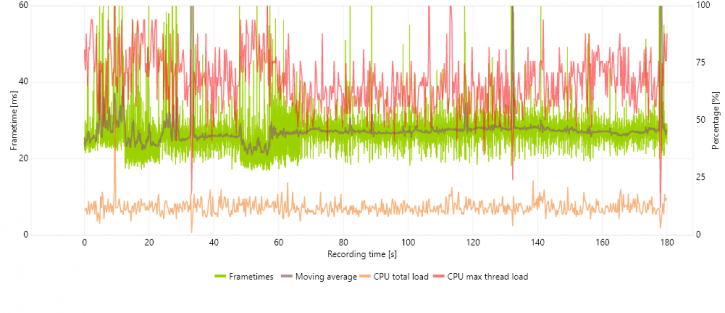
In brown, the CPU utilization in total (brown) and max tread utilization load in red.
