Performance - Platform - VRM Area Thermals
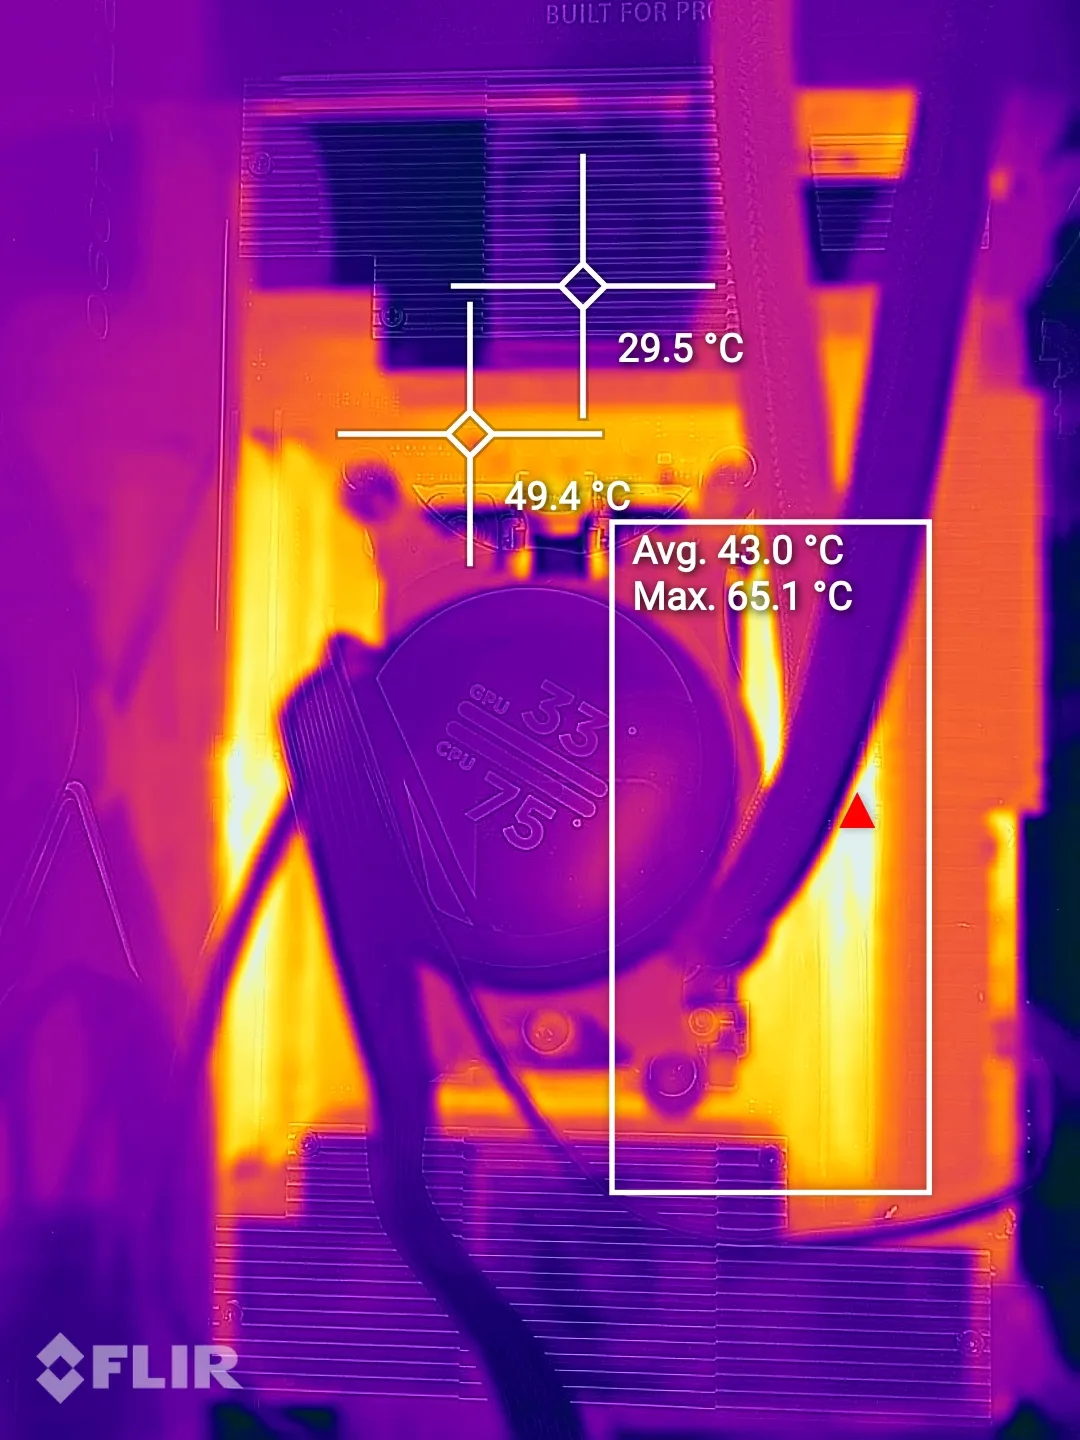
Thermal imaging
We could hook into sensors and start measuring. Now a good way really is to look at the VRM area with a thermal camera. This way you can detect hot spots and/or worrying stuff. We run the FPU and CPU torture test in AIDA. The chart plot shows the maximum VRM temperature measured at the thermal sensor level. The VRM temperatures you see listed in the chart are not based upon the thermal image, but the max temp reported by the thermal sensors at the VRM stages.
The thermal image is there for visualization of heat bleed, not measurement as most part of the VRM is covered by heatsinks.
- System setup: normal conditions/default settings / 100% CPU load on all cores
We see nothing that concerns us. The hotspot btw actually is memory, it has no heatspreader.
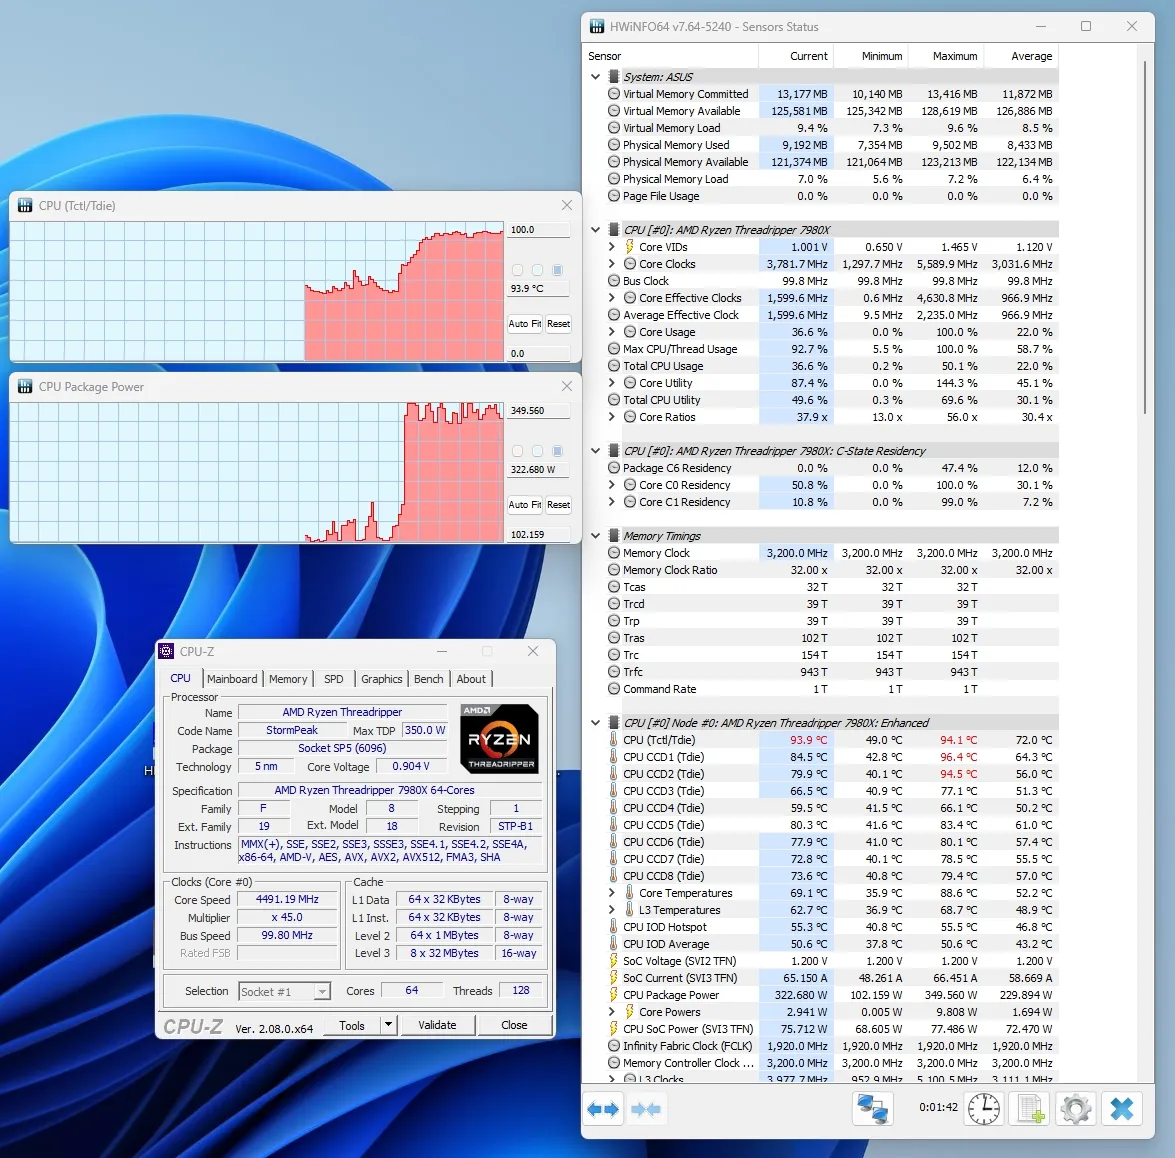
Temperatures
Temperature data comparison necessitates the consistent application of identical cooling across all platforms, making it a challenging parameter to standardize. Cooling responses vary due to differences in coolers' RPM, TDP, and the configurations set in the motherboard BIOS. Therefore, our approach focuses on a temperature stress test. For this review, a 360mm LCS cooler (Asus Ryujin III 360) is employed, with the processor showing an operational temperature of 80~90°C under an all-core stress at the processor's maximum wattage settings.