
SSD Performance Long Duration Degradation Consistency test
Testing Performance Degradation
New in our test suite is a Long Duration Degradation Consistency test. In this test we look at SSD performance after using us continuously with heavy workloads for almost 24 hours. Basically we fire off scripted traces of workloads emulating games, Excel and Photoshop workload usage. In total there are workload 18 phases that will test the throughput of the SSD, 8 Degradation Phase, 5 Steady State Phase and 5 runs of the Recovery Phase. In order to complete these tests we need almost a full day, this test will write roughly 3.2 TB / 3200 GB of data towards the SSD. So if you normally write 10 GB of data per day on your SSD, with this test during this one day we emulate roughly 320 days of usage.
And what we are looking for is the answer to this question, how will the SSD perform after heavy (massive) usage.
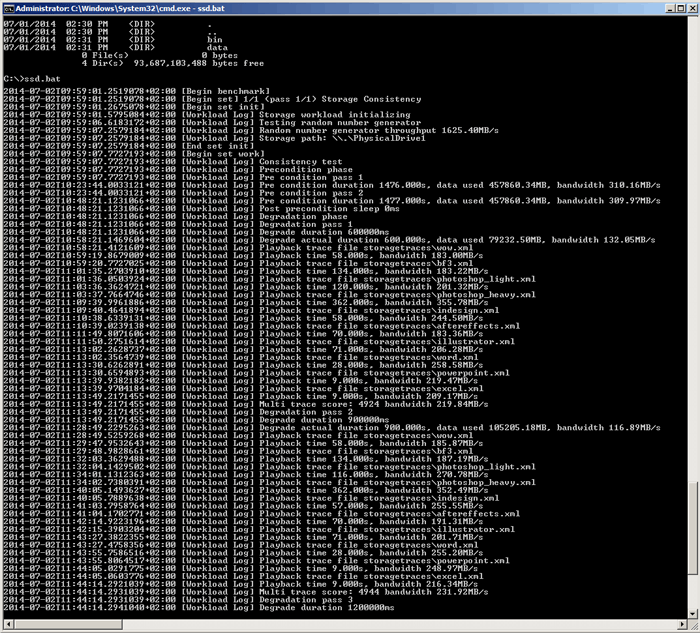 The consistency test takes roughly a day to finish and is based on multiple game and content creations workloads
In several stages we'll look at the performance band-with. If the SSD is good a current SATA3 class SSD after almost a day of stress testing should show consistent performance. A good SSD will show a flat line in-between 200 to 300 MB/sec in terms of storage bandwidth.
In each tested phase we run multiple workloads including games like Battlefield 3 and World of Warcraft. On the other side we have Adobe After Effects, Illustrator, InDesign, Photoshop Heavy and Photoshop Light, Microsoft Excel, Powerproint and Word, then basically the test will perform this pattern:
- PRECONDITIONING -The entire SSD is filled twice sequentially with random data of a 128KB file size. The second run accounts for overprovisioning that would have escaped the first.
- DEGRADATION PHASE – The SSD is hit with random writes of between 4KB and 1MB for 10 minutes and then a single pass performance test is done of each application. The cycle is repeated 8 times, and with each time, the duration of random writes increases by 5 minutes.
- STEADY STATE PHASE – The drive is hit with random writes of between 4KB and 1MB for 45 minutes before each application is put through a performance test. This process is repeated 5 times.
- RECOVERY PHASE – The SSD is allowed to idle for 5 minutes before and between performance tests of all applications. This is repeated 5 times which accounts for garbage collection.
- CLEANUP – The entire SSD is written with zero data at a write size of 128KB
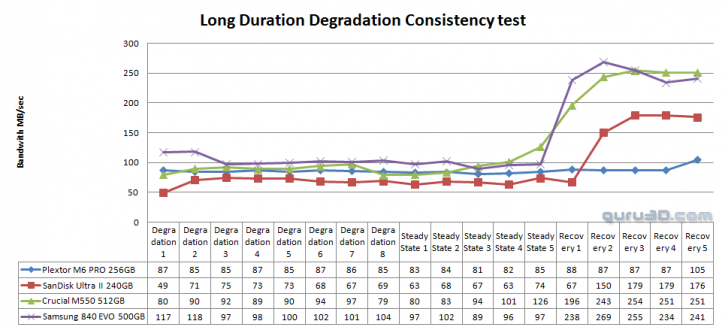
Simply put, a straight line as high as possible in the upper chart = good.
The steady state value is roughly the degradation under full stress but in the recovery phase it will regain its performance. The Sandisk Ultra II is performing OK in the recovered state and truth be told here, that is the state where you guys, the gamers and true Gurus use their computers in. If you are continuously writing data and really hammering your system, then the the degraded performance states are of importance.
The results are average at best, then again this test is brutal.
