
DX11 - Frametime performance
With a new benchmark technology called FCAT on the following three pages we will look into Frame Experience Analysis. Basically with the charts shown we are trying to show you graphics anomalies like stutters and glitches in a plotted chart. Lately there has been a new measurement introduced, latency measurements. Basically it is the opposite of FPS.
- FPS mostly measures performance, the number of frames rendered per passing second.
- Frametime aka Frame Experience recordings mostly measures and exposes anomalies - here we look at how long it takes to render one frame. Measure that chronologically and you can see anomalies like peaks and dips in a plotted chart, indicating something could be off.
| Frame time in milliseconds |
FPS |
| 8.3 | 120 |
| 15 | 66 |
| 20 | 50 |
| 25 | 40 |
| 30 | 33 |
| 50 | 20 |
| 70 | 14 |
We have a detailed article (read here) on the new FCAT methodology used, and it also explains whay we do not use FRAPS anymore.
Frametime - Basically the time it takes to render one frame can be monitored and tagged with a number, this is latency. One frame can take say 17ms. Higher latency can indicate a slow framerate, and weird latency spikes indicate a stutter, jitter, twitches basically anomalies that are visible on your monitor.
What do these measurements show?
But basically what these measurements show are anomalies like small glitches and stutters that you can sometimes (and please do read that well, sometimes) see on screen. Below I'd like to run through a couple of titles with you. Bear in mind that Average FPS matters more than frametime measurements. It's just an additional page or two of information that from now on we'll be serving you.
Single GPU Frame experience
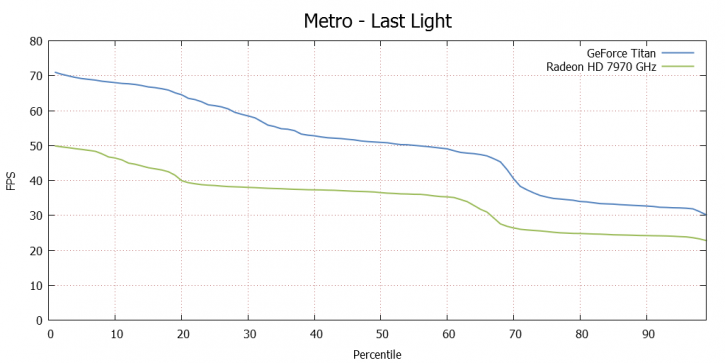
Above, a percentile chart of the 30 seconds @ 2560x1440. Here we plot FPS and place it in relation to percentiles.
- 50% of the time measured frames is doing roughly 50 FPS for GeForce Titan, the R7970 GHz hovers at 38 FPS here.
- To the right you'll notice that the last 5% of the frames is at 20 to 30 FPS or lower. This is another and valid way of looking at performance.
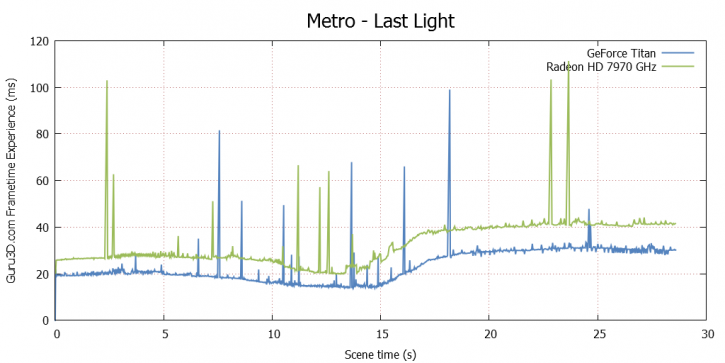
Above, the cards at 2560x1440.On this 30 second run the graphics card manages to remain roughly below 30ms; as you can see both cards show stutters, we can confirm these as visible on screen. This happens with ALL cards tested at any resolutions, so it is game-engine or system related.
With this chart, lower = better. Huge spikes above 40-50ms can be considered a problem or indicate a low framerate.
Multi-GPU Frame experience
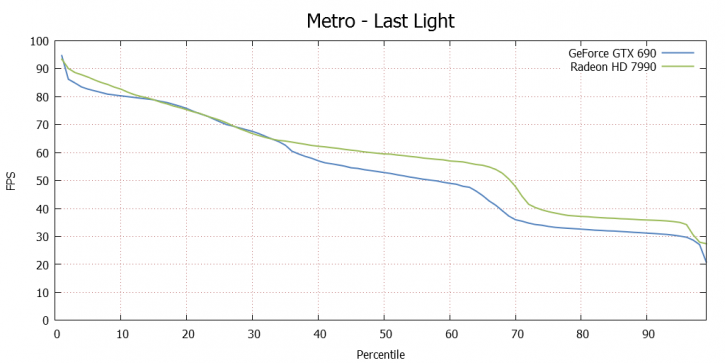
We now step into multi-GPU rendering with the GeForce GTX 690 and the feisty Radeon HD 7990. Above, a percentile chart of the 30 seconds @ 2560x1440. Here we plot FPS and place it in relation to percentiles.
- 50% of the time measured frames is doing roughly 60 FPS for Radeon HD 7990, the GTX 690 hovers at 53 FPS here.
- To the right you'll notice that the last 5% of the frames is at 20 to 30 FPS or lower. This is another and valid way of looking at performance.
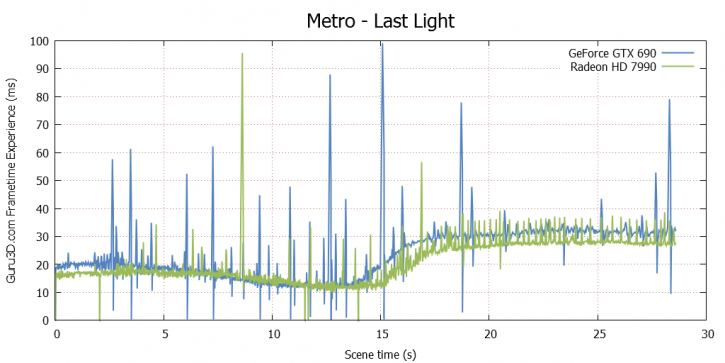
Above, the cards at 2560x1440.On this 30 second run the graphics card manages to remain roughly below 30ms; as you can see again both cards show stutters, we again can confirm these as visible on screen. This happens with ALL cards tested at any resolutions, so it is game-engine or system related.
Mind you that you can see a definitive improvement for frame pacing on AMD's behalf as the turnaround latency is pretty good. With this chart, lower = better. Huge spikes above 40-50ms can be considered a problem or indicate a low framerate.
We have to note that the GTX 690 was showing massive shimmering with the 320.14 driver used. Not really pleasant on the eyes.
