.jpg)
DX12: FCAT Frame Experience Analysis Ashes Of Singularity
Ashes Of Singularity Frame Experience Analysis
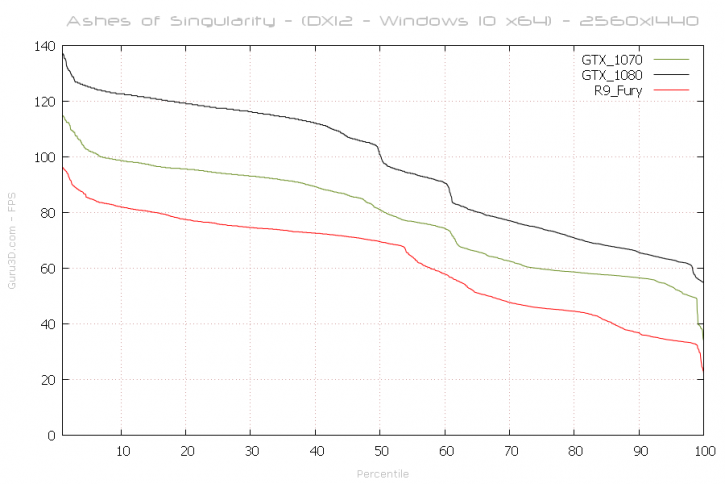
Above, the percentile chart of a 31 second recording @ 2560x1440. Here we plot FPS and place it in relation to percentiles. We do have DirectX 12 enabled again.
- GeForce GTX 1070 - 50% of the time measured frames is doing roughly 80 FPS, so that is the average framerate (higher = better).
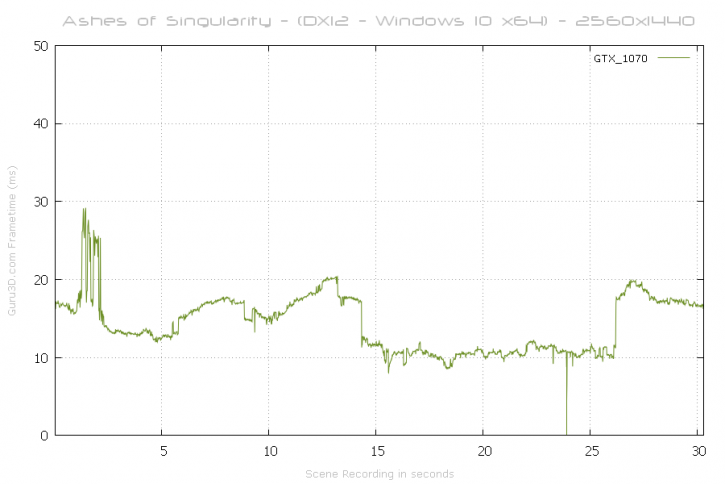
We expected a bit of trouble in DX12 with Nvidia cards, but that is not the case. We cannot see a significant enough glitch or stutter in frametime scaling (chart wise) that is extremely significant or long-lasting. With this chart, lower = better. Huge spikes above 40 ms to 50 ms can be considered a problem like a stutter or indicate a low framerate.
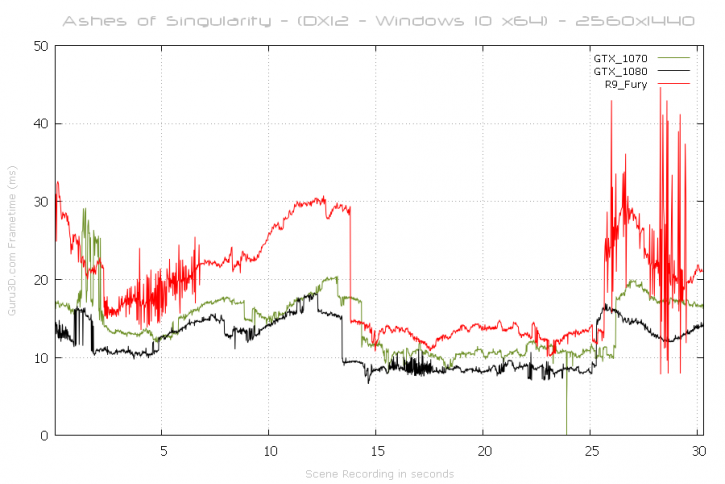
And combined, the GeForce GTX 1070 / 1080 and the R9 Fury from AMD. Though the cards perform well we do see more inconsistency with the Fury, especially in the final 5 seconds of our recording there's a lot of stuff going on. Though in their defense, none of that is really visible on screen. But yeah, it's a difference alright.
