Frametime and latency performance
Frametime and latency performance
With a benchmark technology called FCAT on the following two pages, we will look into Frame Experience Analysis. Basically with the charts shown we are trying to show you graphics anomalies like stutters and glitches in a plotted chart. Lately there has been a new measurement introduced, latency measurements. Basically it is the opposite of FPS.
Above an example recording of FCAT frames being captured with a GeForce GTX 980 Ti in the Far Cry Primal integrated benchmark
- FPS mostly measures performance, the number of frames rendered per passing second.
- Frametime AKA Frame Experience recordings mostly measures and exposes anomalies - here we look at how long it takes to render one frame. Measure that chronologically and you can see anomalies like peaks and dips in a plotted chart, indicating something could be off.
| Frame time in milliseconds |
FPS |
| 8.3 | 120 |
| 15 | 66 |
| 20 | 50 |
| 25 | 40 |
| 30 | 33 |
| 50 | 20 |
| 70 | 14 |
We have a detailed article (read here) on the new FCAT methodology used, and it also explains why we do not use FRAPS anymore. Frametime - Basically the time it takes to render one frame can be monitored and tagged with a number, this is latency. One frame can take say 17 ms. Higher latency can indicate a slow framerate, and weird latency spikes indicate a stutter, jitter, twitches; basically anomalies that are visible on your monitor.
What Do These Measurements Show?
Basically, what these measurements show are anomalies like small glitches and stutters that you can sometimes (and please do read that well, sometimes) see on screen. Below I'd like to run through a couple of titles with you. Bear in mind that Average FPS matters more than frametime measurements.
Frame Pacing / Frametime - Single GPU
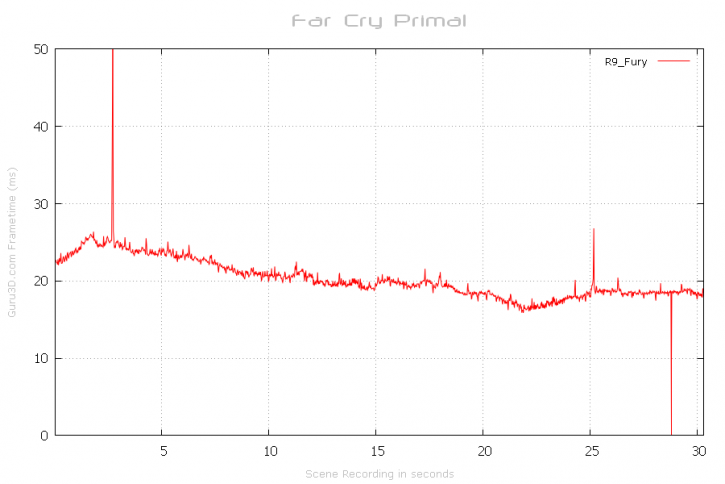
Above a plotted frame-time results of the test run @ 2560x1440 performed with a single Radeon R9 Fury (4GB) in 2560x1440 (WQHD). There is one visible spike, that you can see in the recording. There is also one framedrop. Considering these are almost 2000 recorded frames this is trivial at best. Nvidia then, have a look below:
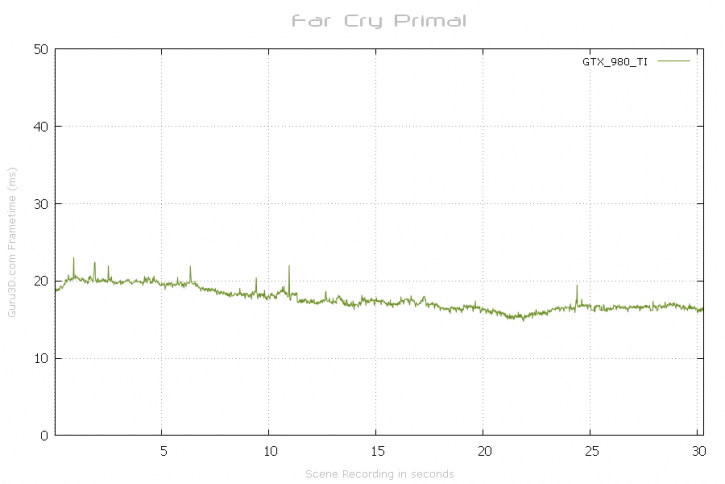
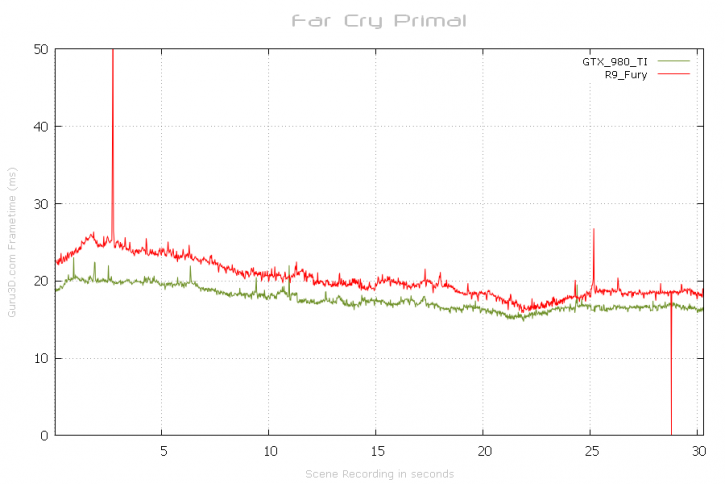
Here we use a GeForce GTX 980 Ti at 2560x1440. This test run lasts roughly 30 seconds and is based on the benchmark recording. in the screenshot below we combine the results. As you can see, very similar characteristics for both vendors aside from one stutter and a frame drop with the Fury. If you are wondering why we do not use a Fury X, simple. FCAt needs a DVI output and the Fury X does not have such an output.