
Multi-GPU - (FCAT)
Frametime and latency performance
With FCAT we will look into Frame Experience Analysis. Basically with the charts shown we are trying to show you graphics anomalies like stutters and glitches in a plotted chart. Lately there has been a new measurement introduced, latency measurements. Basically it is the opposite of FPS.
- FPS mostly measures performance, the number of frames rendered per passing second.
- Frametime AKA Frame Experience recordings mostly measures and exposes anomalies - here we look at how long it takes to render one frame. Measure that chronologically and you can see anomalies like peaks and dips in a plotted chart, indicating something could be off.
| Frame time in milliseconds |
FPS |
| 8.3 | 120 |
| 15 | 66 |
| 20 | 50 |
| 25 | 40 |
| 30 | 33 |
| 50 | 20 |
| 70 | 14 |
We have a detailed article (read here) on the new FCAT methodology used, and it also explains why we do not use FRAPS anymore. Frametime - Basically the time it takes to render one frame can be monitored and tagged with a number, this is latency. One frame can take say 17 ms. Higher latency can indicate a slow framerate, and weird latency spikes indicate a stutter, jitter, twitches; basically anomalies that are visible on your monitor.
What Do These Measurements Show?
What these measurements show are anomalies like small glitches and stutters that you can sometimes (and please do read that well, sometimes) see on screen. Below I'd like to run through a couple of titles with you. Bear in mind that Average FPS often matters more than frametime measurements.
FPS plot - Multi GPU
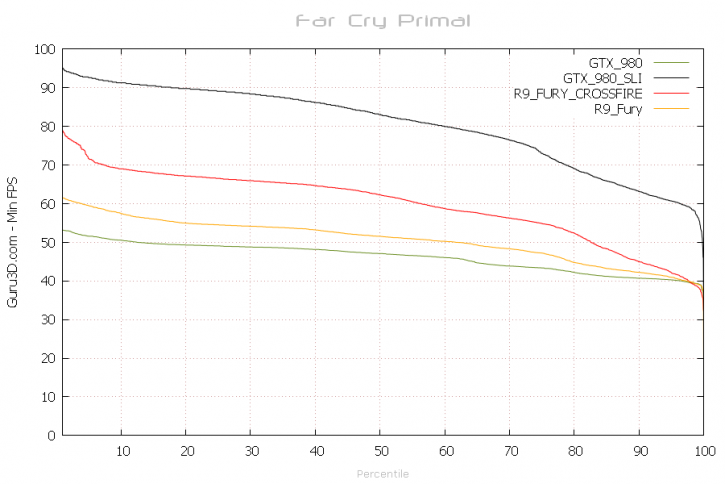
Above framerates relative to percentiles. Basically we take all recorded 1800 frames and place them in a relative chart towards FPS. At 50% you would be looking at your average framerates as measured with FCAT. Higher is better. We measure at Quad HD (2560x1440) as we are tied to the DVI output connector with FCAT. At Ultra HD the Radeon R9 Fury CFX obviously would be at the top. Let's move on-wards to frame-times (latency measurements) though
Frame Pacing / Frametime - Multi GPU
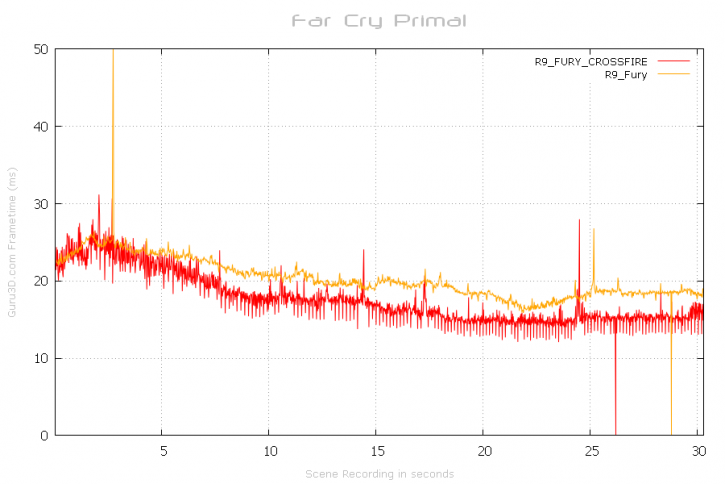
Above a plotted frame-time results of the test run @ 2560x1440 performed with a single Radeon R9 Fury (4GB) in 2560x1440 (WQHD) both single and in Crossfire. There is one visible spike for each that you can see in the recording. There is also one framedrop. Considering these are almost 2000 recorded frames this is trivial at best. We see some frame variation in latency with the Crossfire setup, this could be easily interpreted as micro-stuttering, but (aside from the first seven seconds) the frames are too far away from each other for that. You can't really see it on screen either. There is something going on though.
Nvidia then, have a look below:
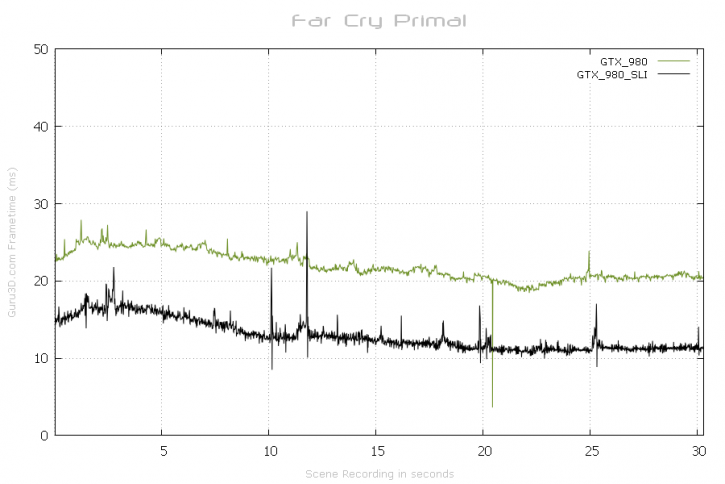
Here we use a GeForce GTX 980 Ti at 2560x1440 single & SLI. This test run lasts roughly 30 seconds and is based on the benchmark recording. Aside from one stutter there isn't anything to get concerned about. Frame pacing looks to be more uniform with SLI, albeit that is a very relative thing to say as on the Fury CFX combo you can't visually see any weirdness either.
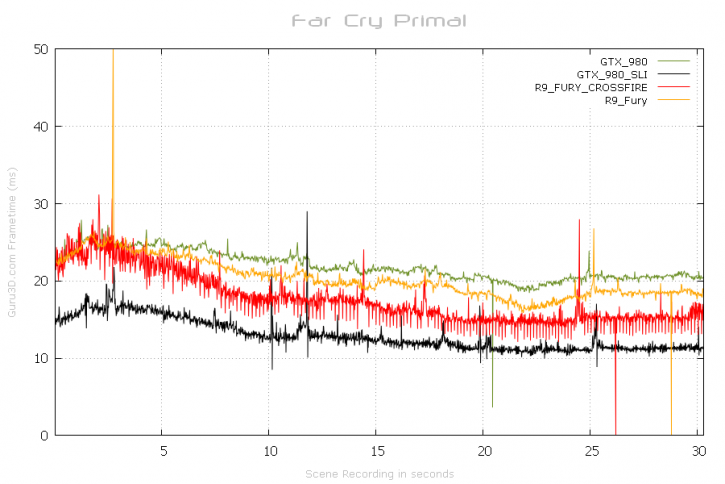
In the output chart above we combined all results from the single and 2-way Multi-GPU cards. Again this is 2560x1440, at 3840x2160 the Fury CFX combo would have been in the lead.
