Testing
Testing
Unfortunately it's going to be nearly impossible to stress this PSU as much as I would like with the hardware I currently have available to me. The Dual-core Opteron/X1800 setup will show any obvious weakness in a lower quality or lower power PSU but will not really strain this BeQuiet unless it's faulty (which it's not). Test results are of course mandatory in any review though, so below you can see our results. Both the CPU & GPU are overclocked in an attempt to stress the PSU a little more.
Hardware used:
- Opteron 165 (Dual Core) @ 2.7GHz
- DFI LanParty UT nF4 Ultra-D
- 2GB G.Skill HZ PC4000
- HIS X1800XT 512MB @ 700/850
- X-Fi Xtreme Music
- 250GB Samsung IDE
- 320GB WD SATA2
- NEC 3520A
Readings were taken with a digital multimetre. Full load consisted of two instances of Prime95 (one for each core) and looping 3dmark05.
Multimetre results:
| Rail | Load Low | Load High |
| +12v | 12.06 | 12.10 |
| +5v | 5.02 | 5.05 |
| +3.3v | 3.31 | 3.32 |
Above are the voltage readings for 100% load mode (stressed as much as we can). We noted down the lowest and highest values we saw and that is the fluctuation. If a PSU is unstable we'd see much fluctuation, differences and discrepancies which can result in system instability.
"Low" in the table is the lowest measured value and "High" is of course the highest peak we measured. A 5% fluctuation is perfectly acceptable, it's in fact the ATX standard. So 12 volts for example should remain between 11.4 - 12.6v. And that it does.
Below you will find a graph which was generated using OCCT's built in test. This graph shows the 12v rail on the PSU and it's figures during a stress test. What you'll notice though is that the figures on the graph differ from the figures in the table above. The figures in the table were taken using a digital multimetre, the figures in the graph below were taken using the motherboard sensors. I've included this purely because this is a great example of how inaccurate motherboard sensors are and why everyone should invest in a half decent DMM if they want to check their rails reliably. It's not a huge difference in this particular case, but it is something people should be aware of.
Motherboard sensor results:
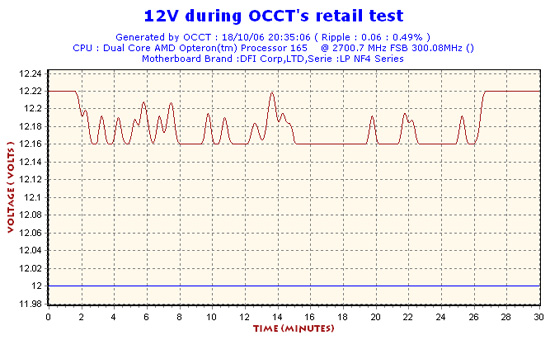
This graph shows the 12v rail as measured by the inaccurate motherboard sensors. The red line is our PSU's progress throughout the stress test and the blue line is dead on 12v, the benchmark figure if you like.
*Do not confuse the graph with the actual results which are in the table above.
The PSU remained stable and within the 5% stability rule during testing. Furthermore I have been using this PSU for the last week for a lot of heavy gaming sessions amongst general use and I haven't encountered a single problem.
We pushed yet couldn't really stress the PSU that badly. Perhaps this should be my excuse to upgrade to an overclocked Core2Duo & SLI/Crossfire rig...
Anyway, let's move on to the verdict.
