Page 9
Les températures de la carte graphique
As with any graphics card we test, we also take a look at heat build-up in the GPU. Let's have a look. We measured at a room temperature of 22 Degrees C. For the measurement we run a couple of 3DMark timedemo's which will utilize the GPU core 100%; we then simply start to monitor the heat build-up in the graphics core.
I inserted a GeForce 8600 GT in here as well. We only recently started tracking GPU temps in this visual way.
The results are not bad, PowerColor had it's own customized cooler on the 2600 XT though, and it works really good. 24 hours prior to the release of this article a new Rivatuner beta arrived (sorry not public just yet). Have a peek at the heat build-up on the PowerColor gDDR3 card:
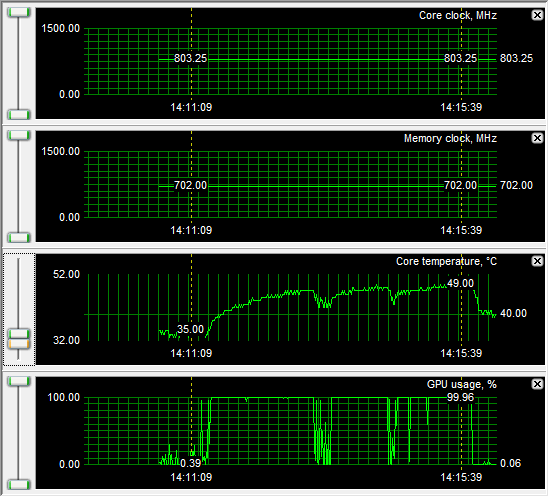
As you can observe, that's just really good. Also as you can see we've been working on a new monitoring feature; the new 2400 and 2600 products will allow us to monitor GPU usage. You are used to this with your CPU, so now we can monitor GPU usage. The benefit here is that internal clocks are adjusted based on this value at hardware level on the 2600 and 2400. Why is this important ? Power consumption ... lowering the clock dynamically also lower overall power consumption.
In the upcoming weeks we'll release the new update of Rivatuner supporting this new feature.
Noise Levels coming from the graphics card
When graphics cards produce a lot of heat, that heat usually needs to be transported away from the hot core as fast as possible. Often you'll see massive active fan solutions that can indeed get rid of the heat, yet all the fans these days make the PC a noisy son of a gun. I'm doing a little try-out today with noise monitoring, so basically the test we do is extremely subjective. We bought a certified dBA meter and will start measuring how many dBA originate from the PC. Why is this subjective, you ask? Well, there is always noise in the background, from the streets, from the HD, PSU fan etc etc, so this is by a mile or two not a precise measurement. You could only achieve objective measurement in a sound test chamber.
The human hearing system has different sensitivities at different frequencies. This means that the perception of noise is not at all equal at every frequency. Noise with significant measured levels (in dB) at high or low frequencies will not be as annoying as it would be when its energy is concentrated in the middle frequencies. In other words, the measured noise levels in dB will not reflect the actual human perception of the loudness of the noise. That's why we measure the dBa level. A specific circuit is added to the sound level meter to correct its reading in regard to this concept. This reading is the noise level in dBA. The letter A is added to indicate the correction that was made in the measurement. Frequencies below 1kHz and above 6kHz are attenuated, where as frequencies between 1kHz and 6kHz are amplified by the A weighting.
| TYPICAL SOUND LEVELS | ||
| Jet takeoff (200 feet) | 120 dBA | |
| Construction Site | 110 dBA | Intolerable |
| Shout (5 feet) | 100 dBA | |
| Heavy truck (50 feet) | 90 dBA | Very noisy |
| Urban street | 80 dBA | |
| Automobile interior | 70 dBA | Noisy |
| Normal conversation (3 feet) | 60 dBA | |
| Office, classroom | 50 dBA | Moderate |
| Living room | 40 dBA | |
| Bedroom at night | 30 dBA | Quiet |
| Broadcast studio | 20 dBA | |
| Rustling leaves | 10 dBA | Barely audible |
We start up a benchmark and leave it running for a while. The fan rotational speed remains constant. We take the dBA meter, move away 75 CM and then aim the device at the active fan on the graphics cards.
| Card |
dBA |
| HD2600XT GDDR3 |
44 |
| HD2400XT |
44 |
| HD2600XT GDDR4 |
45 |
Nothing to be ashamed about, all cards are relatively quiet and create normal acceptable noise levels.
