Well, that was fast. Benchmark results of the complete announced Zen 3 lineup in Cinebench R20 have surfaced on the German website CPU-monkey.
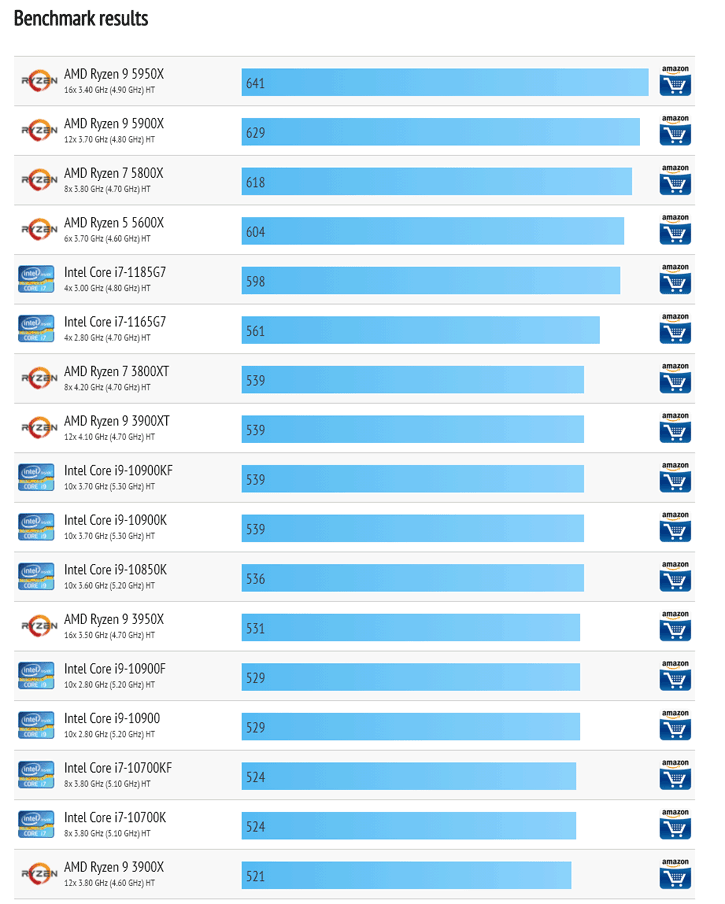
The site also contains figures for many other processors, which makes comparison possible. Below is an overview of the ten best-scoring CPUs in R20 Single-Core, based on the data from CPU-monkey.
| CPU | Cores / threads | Base / boost (GHz) | R20 Single-Core | R20 Multi-Core |
|---|---|---|---|---|
| AMD Ryzen 9 5950X | 16/32 | 3.40 / 4.90 | 641 | 10,360 |
| AMD Ryzen 9 5900X | 12/24 | 3.70 / 4.80 | 629 | 8,168 |
| AMD Ryzen 7 5800X | 8/16 | 3.80 / 4.70 | 618 | 5,724 |
| AMD Ryzen 5 5600X | 6/12 | 3.70 / 4.60 | 604 | 4,312 |
| Intel Core i7-1185G7 | 4/8 | 3.00 / 4.80 | 598 | 2,477 |
| Intel Core i7-1165G7 | 4/8 | 2.80 / 4.70 | 561 | 2,234 |
| AMD Ryzen 7 3800XT | 8/16 | 4.20 / 4.70 | 539 | 5,122 |
| AMD Ryzen 9 3900XT | 12/24 | 4.10 / 4.70 | 539 | 7,244 |
| Intel Core i9-10900KF | 10/20 | 3.70 / 5.30 | 539 | 6,399 |
| Intel Core i9-10900K | 10/20 | 3.70 / 5.30 | 539 | 6,399 |
The results certainly are looking good, positioning Zen 3 at the top. A 5950X is about 7% higher than that of the Tiger Lake CPU, on a desktop level the 5950X scores about 19% better than the i9 10900K (F). AMD has shown some R20 benchmarks in its Zen 3 reveal, these scores seem to match closely to the website's results. It is not known what the source of this is or how these have been tested.
Ryzen 5000 - Zen 3 lineup Cinebench R20 scores pop up in database