An interesting slide has been compiled that shows the varying market share relative to sales for add in board graphics cards sales from both AMD and NVIDIA relative to generational releases.
I stumbled in to his chart at TPU who posted about it today, but this chart has been compiled by 3dcenter. Use the numbers with a bit of caution as the numbers differ a bit from the JPR results posted and updated regularly. Basically the chart starts in 2002 and depending on sales shows the market-share of the specific category in-between AMD and NVIDIA and specific product releases.
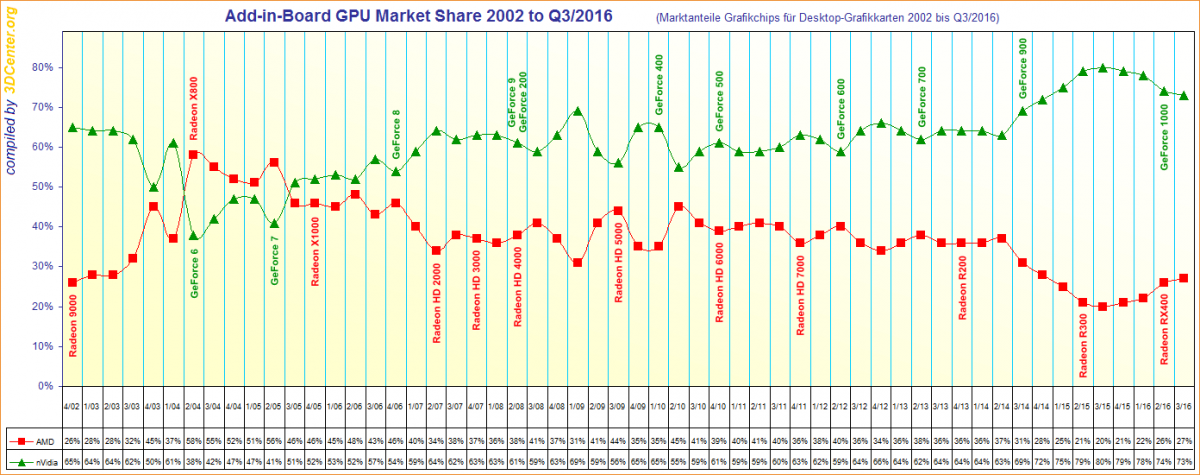
So the fun thing about the chart is that you can observe the effect of a specific graphics card release at a given point in time relative the demand. Very interesting to see are the peaks especially in Q2 2004 when AMD released the X800 (check review here) and ther massive gain in market share in Q4 2014 when Nvidia released the GeForce 900 series.
You can click on the thumbnail to watch the compiles chart/plot.
AMD and NVIDIA AIB GPU Market Share from 2002 to 2016