Article
Benchmarking Graphics Processors - The New Style
The past couple of months, we have seen some interesting dynamics in measuring the framerate of your games versus graphics cards. Basically the framerate of your game is, simply put, the number of frames per second your computer and graphics card are able to render. It is the most common way of looking at graphics card and game performance really.
There's a problem that started floating at the surface for a while now, FPS does not say much as to what you see and experience on screen thus on your monitor, in certain conditions you can get a little stuttering every now and then. E.g. FPS will not say a thing about graphics anomalies. Up-to a while ago nobody really cared that, and some of you perhaps think that is the best way to approach this. Do you really care of you see a small stutter every now and then for a fraction of a second maybe split-second? The answer to that is two fold. Some of you, the more enthusiast end users, do while other's don't. And as such lately we have seen websites posting frame-capture and frame time results.
Being trendy - websites jumped onto it and are using FRAPS, but the thing is... if you want to expose game stutters you probably should not use FRAPS. Here's why:
FRAPS measures directly at the game engine, and that's different from what you see on screen on your monitor. For FPS that is not really relevant, but if you want to measure frametime then at the end of the graph shown above T_Display is where you need to be. See, a lot of other stuff is happening after FRAPS measures. Now realistically for single graphics cards, measuring frametime (or as what like to call, frame experience) FRAPS is sufficient. However in multi-GPU setups FRAPs just does not detect all information and as such a lot simply does not show up, in the created charts that many websites including ourselves have been demonstrating.
It will get even weirder as it also works vice versa, sometimes FRAPS records stuff that isn't visibly there on your monitor. To do frametime recordings right (the proper way) we need to take a more academic approach... not measure at Game engine level, but at the monitor output as that is the hotspot as to what you see on your screen. How can we accomplish that? Well, with a framegrabber and a complex software suite which we'll be showing and introducing today. It is called FCAT, short for Frame Capture Analysis Tool. It is a set of tools that derives from the NVIDIA performance laboratory. Now please don't throw objectivity and subjectivity concerns at us as yes, this methodology is coming from NVIDIA. Let me state upfront that pretty much all software and scripts can be read out as source code and the simple truth is that the FCAT benchmark method can't see the difference in-between AMD and NVIDIA graphics cards as we look at rendered frames, we are not measuring inside the graphics card(s).
Before you read onwards, this article is more a bit more scientific, complex and academic opposed to what you are used to. This is not everybody's cup of tea alright. But I wanted to show what we are doing and how we are doing it as transparant as can be. Now then, our FCAT solution requires multiple thousands EUR worth of hardware and is not something you can easily recreate at home. I also left a lot out in terms of complex issues and will take a very simple to understand approach, which hopefully, the majority of you guys and girls can understand. This article is a first in sense that it is an introduction to added benchmarks you are going to see integrated in Guru3D GPU reviews.
Let's first discuss a little about FPS vs Frametime, the methods and challenges ahead.
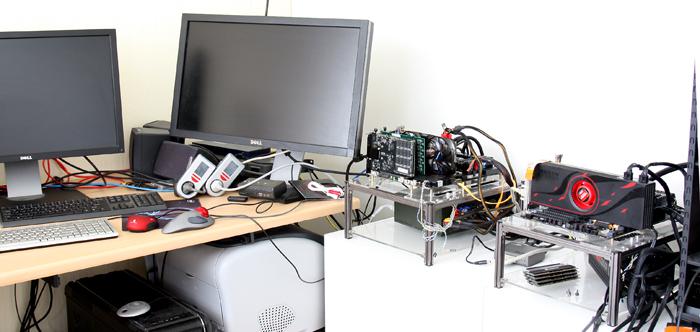
Meet the FCAPS setup - two new dedicated PCs and two monitors merely for a handful of plotted graphs.


