
(FCAT) Frametime experience
Frametime and latency performance
With FCAT we will look into Frame Experience Analysis. Basically with the charts shown we are trying to show you graphics anomalies like stutters and glitches in a plotted chart. Lately there has been a new measurement introduced, latency measurements. Basically it is the opposite of FPS.
- FPS mostly measures performance, the number of frames rendered per passing second.
- Frametime AKA Frame Experience recordings mostly measures and exposes anomalies - here we look at how long it takes to render one frame. Measure that chronologically and you can see anomalies like peaks and dips in a plotted chart, indicating something could be off.
| Frame time in milliseconds |
FPS |
| 8.3 | 120 |
| 15 | 66 |
| 20 | 50 |
| 25 | 40 |
| 30 | 33 |
| 50 | 20 |
| 70 | 14 |
We have a detailed article (read here) on the new FCAT methodology used, and it also explains why we do not use FRAPS anymore. Frametime - Basically the time it takes to render one frame can be monitored and tagged with a number, this is latency. One frame can take say 17 ms. Higher latency can indicate a slow framerate, and weird latency spikes indicate a stutter, jitter, twitches; basically anomalies that are visible on your monitor.
What Do These Measurements Show?
What these measurements show are anomalies like small glitches and stutters that you can sometimes (and please do read that well, sometimes) see on screen. Below I'd like to run through a couple of titles with you. Bear in mind that Average FPS often matters more than frametime measurements.
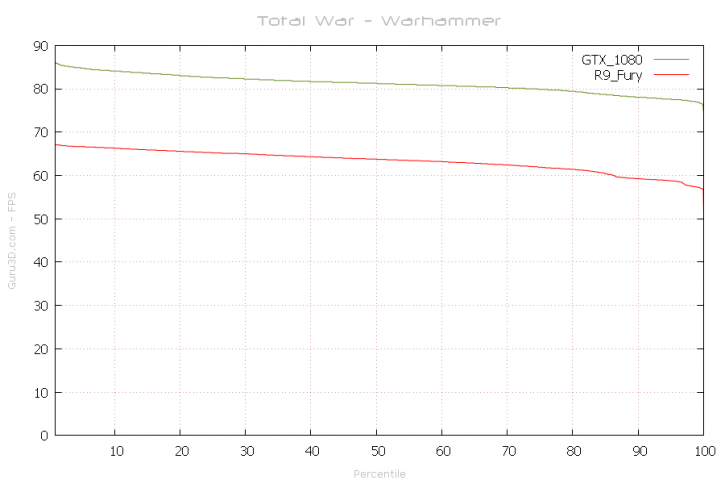
Above an FCAT plot of latency relative to FPS in percentiles. We use the new Geforce GTX 1080 and the Radeon R9 Fury. I often get asked the question why we do not include the Fury X here, well FCAT is dependant of a DVI monitor output, and AMD is quickly 'phasing them out', we do wonder why. Only board partner cards come with DVI (dual-link required so adapters do not work either). Hence the R9 Fury is the one from ASUS with a proper DVI output connector. So at 50% you could consider to be the average frame-rate. The plot is based on the first 31 seconds measured in the benchmark.
Frame Pacing / Frametime
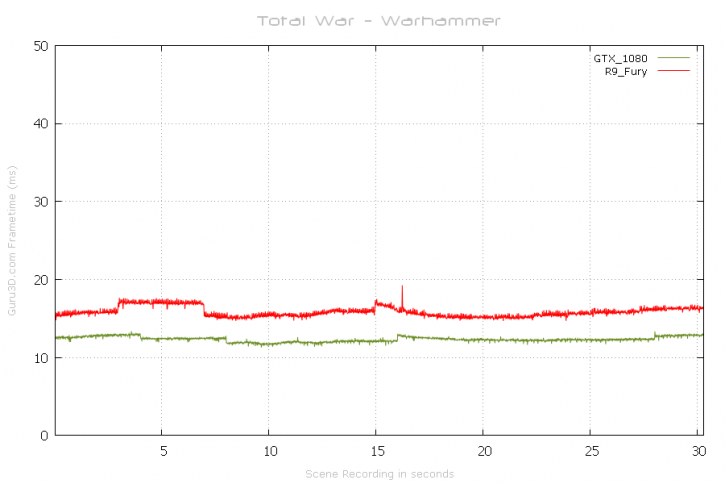
Above a the frame-time results plot of the test run @ 2560x1440 (WQHD) performed with a Radeon R9 Fury (4GB) in 2560x1440 (WQHD) and the GeForce GTX 1080. Both graphics card manufacturers seem to have the game well under control, this is excellent albeit the Radeon show a tiny bit of a pacing difference if you'd zoom in deep enough, but the 1080 has it as well it's just rendering at a smaller latency. Sweet results here for both brands really.
