
VGA Image Quality Settings and Test System
Image Quality Settings and Test System
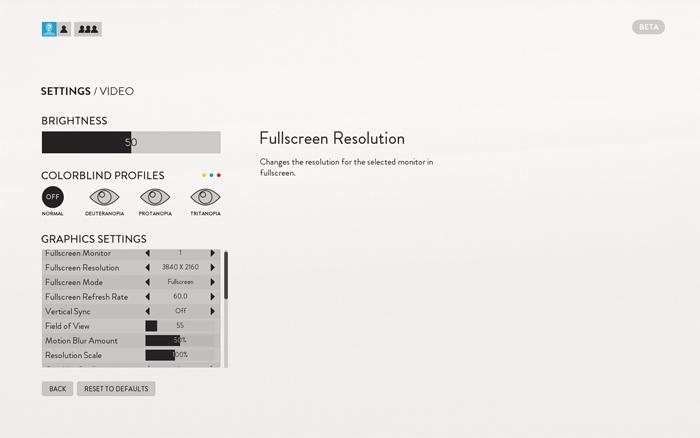
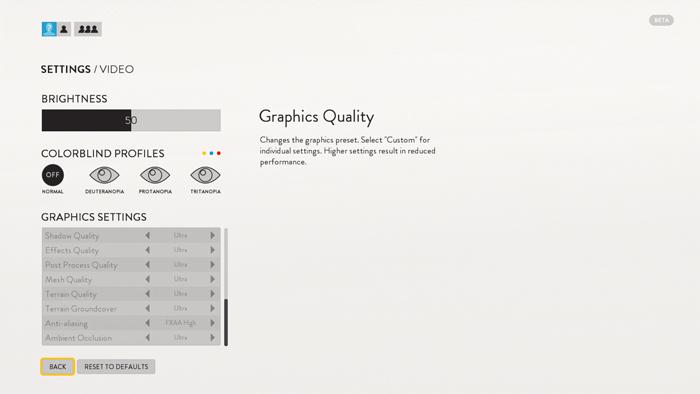
Before we begin with the graphics performance tests a little explanation. We use a time based measurement based upon framerate recording. Since this ttitle does not have a built in benchmark we start a scene and record a part of the level that gives us an average framerate. Our rather nice in-game quality settings are:
The graphics cards used in this article are:
- Radeon R9 370 (4GB)
- GeForce GTX 770
- GeForce GTX 780 Ti
- GeForce GTX 950 (2GB)
- GeForce GTX 960 (2GB)
- GeForce GTX 970
- GeForce GTX 980
- GeForce GTX 980 Ti
- GeForce GTX Titan Black
- GeForce GTX Titan X
- Radeon R9 280X (3Gb)
- Radeon R9 285 (2GB)
- Radeon R9 290
- Radeon R9 290X
- Radeon R9 380 (2GB)
- Radeon R9 390X
- Radeon R9 Fury
- Radeon R9 Fury X
- Radeon R9 NANO
System Specifications
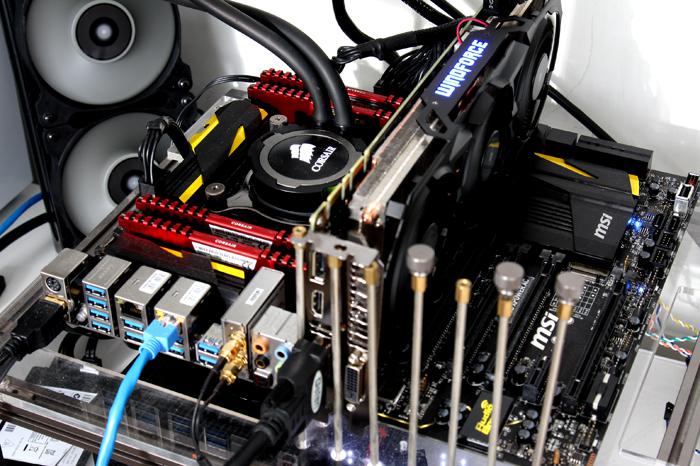
Our test system is based on the eight-core Intel Core i7-5960X Extreme Edition with Haswell-E based setup on the X99 chipset platform. This setup is running 4.40 GHz on all cores. Next to that we have energy saving functions disabled for this motherboard and processor (to ensure consistent benchmark results). We use Windows 10 all patched up. Each card runs on the same PC with the same operating system clone.
- GeForce cards use the latest 358.50 driver (download).
- AMD Radeon graphics cards we used the latest 15.9.1 Beta driver (download).
