DX11: FCAT Frame Experience Analysis Far Cry Primal
Far Cry Primal Frame Experience Analysis
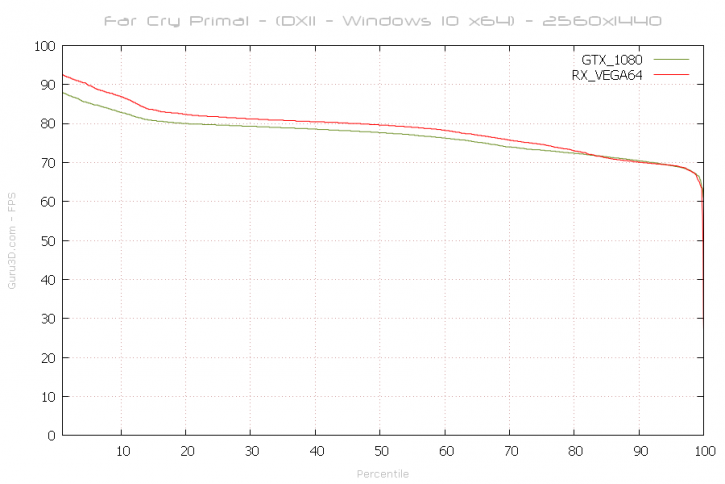
Above, the percentile chart of 31 seconds gaming @ 2560x1440. Here we plot FPS and place it in relation to percentiles. 50% of the time measured frames is the average framerate (higher = better).
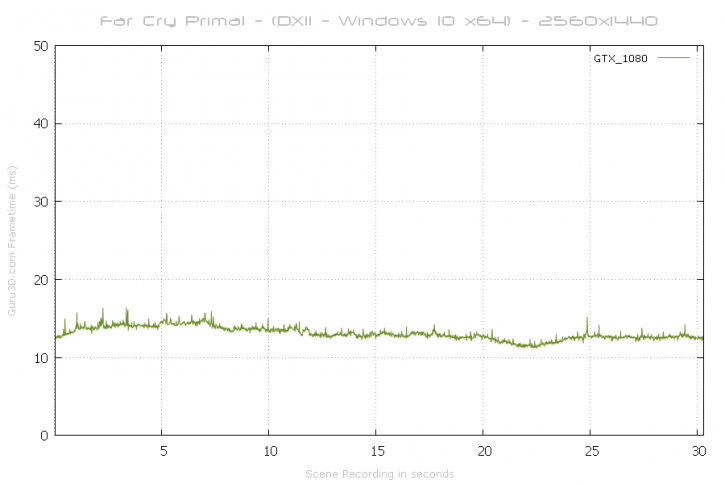
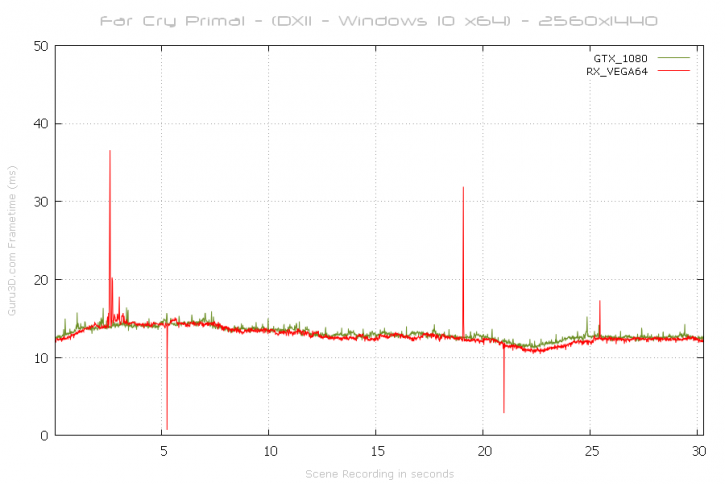
Again, rendering perfection. We cannot detect a significant glitch or stutter in frametime scaling (chart wise) that is extremely significant or longlasting. For those that do not understand what you are looking at, the above is a gametime scene recorded for 31 seconds. With this chart, lower = better.
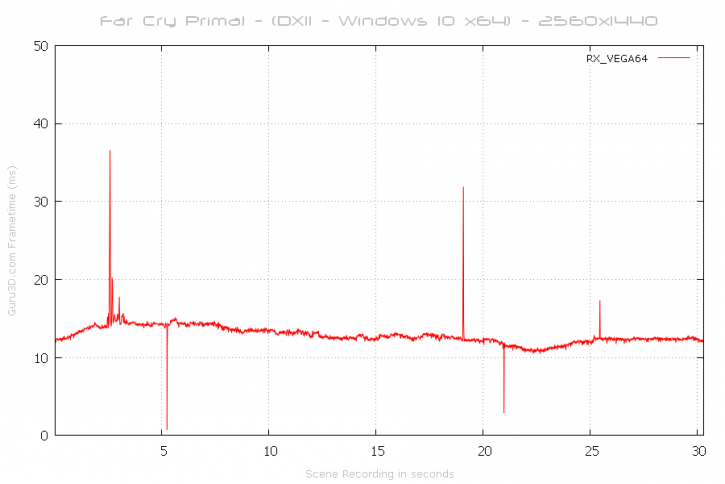
Huge spikes above 40 ms to 50 ms can be considered a problem like a stutter or indicate a low framerate. The Bega 64 show two minor glitches, these might even be game engine rendering related. The big picture overall looks very good though.