DX11: FCAT Frame Experience Analysis Thief
Thief Frame Experience Analysis
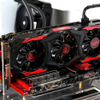
Above, the percentile chart of 31 seconds gaming @ 2560x1440. Here we plot FPS and place it in relation to percentiles.
- 50% of the time measured frames is doing roughly 55~57 FPS, so that is the average framerate (high = better).
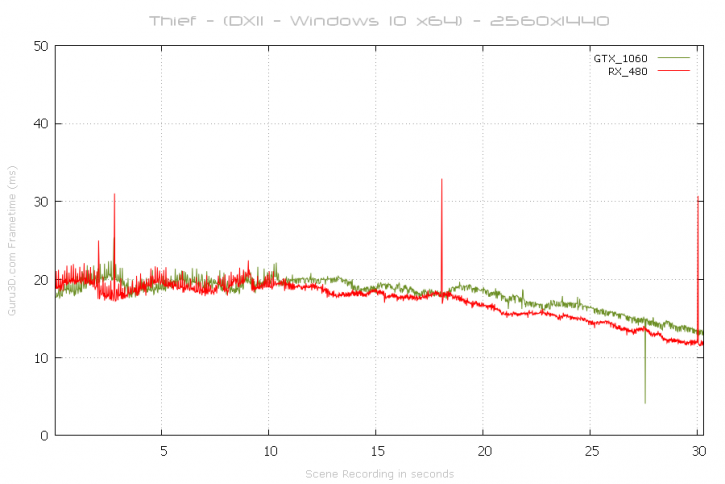
The first 15 seconds of the Thief benchmark sequence are always a little difficult with the rain and everything. That results in very tiny latency bounces, all cards of any brand tested show this visibly on screen. Once it passes the first 15 seconds we no longer detect a significant enough glitch or stutter in frametime scaling (chart wise) that is extremely significant or long-lasting.
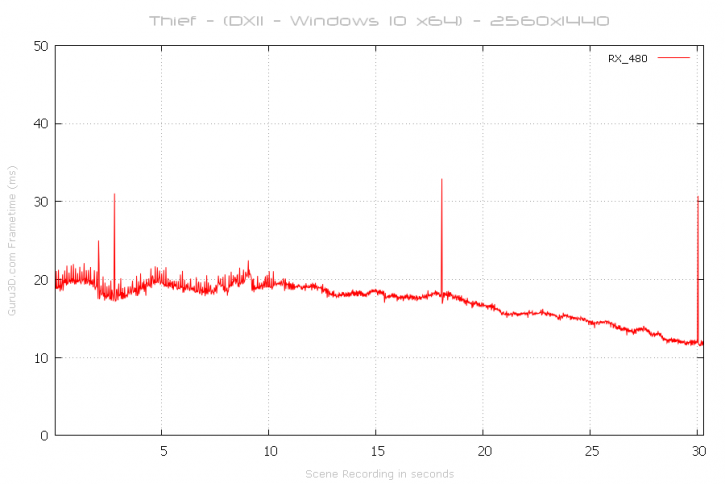
For those that do not understand what you are looking at, the above is a gametime scene recorded for 31 seconds. With this chart, lower = better. Huge spikes above 40 ms to 50 ms can be considered a problem like a stutter or indicate a low framerate.