Game Frametime Analysis GeForce RTX 3070
Game Frametime Analysis
The charts below show you graphics anomalies like stutters and glitches in a plotted chart: frame time and pacing measurements.
| Frame time in milliseconds |
FPS |
| 8.3 | 120 |
| 15 | 66 |
| 20 | 50 |
| 25 | 40 |
| 30 | 33 |
| 50 | 20 |
| 70 | 14 |
- FPS mostly measures performance, the number of frames rendered per passing second.
- Frametime AKA Frame Experience recordings mostly measure and expose anomalies - here, we look at how long it takes to render one frame. Measure that chronologically, and you can see anomalies like peaks and dips in a plotted chart, indicating something could be off.
We have a detailed article (read here) on the methodology behind it all. Basically, the time it takes to render one frame can be monitored and tagged with a number; this is latency. One frame can take, say, 17 ms. Higher latency can indicate a slow framerate, and weird latency spikes indicate a stutter, jitter, twitches; basically, anomalies that are visible on your monitor. These measurements show anomalies like small glitches and stutters that you can sometimes (and please do read that well, sometimes) see on screen. Below I'd like to run through a couple of titles with you. Bear in mind that Average FPS often matters more than frame time measurements.
Please understand that a lower frame time is a higher FPS, so for these charts, lower = better. Huge spikes would be stutters, thick lines would be bad frame pacing, and the graduate streamlining is framerate variation. As you might have observed, we're experimenting a bit with our charts and methodology. Below the game at Ultra HD, with image quality settings as used throughout this review. Tested at ultra quality settings:
Our processor used is the Ryzen 9 5950X (16c/32t ZEN3).
GeForce RTX 3070
Please note that:
- GREEN - Resize BAR ON
- ORANGE - Resize BAR OFF
- Resolution is 2560x1440 (optimal balance in between CPU/GPU).
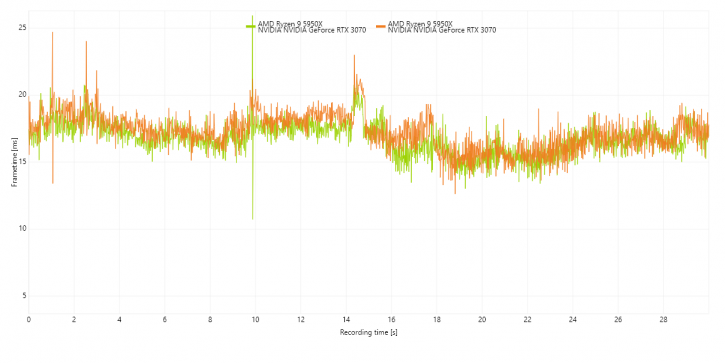
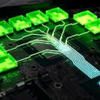
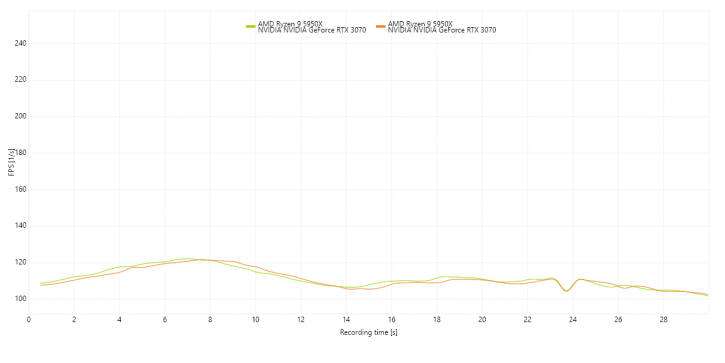
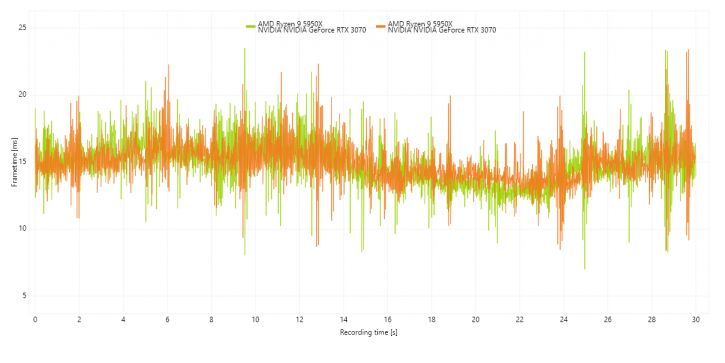
Above Cyberpunk 2077 You can see a small performance effect in the frametime plot.
Above Cyberpunk 2077, the FPS plot also acknowledges a small bump in overall performance.
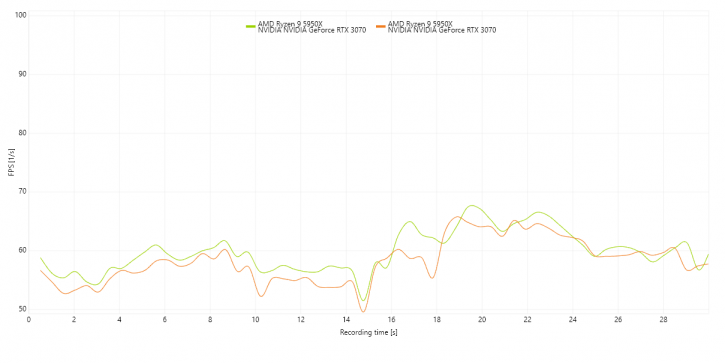
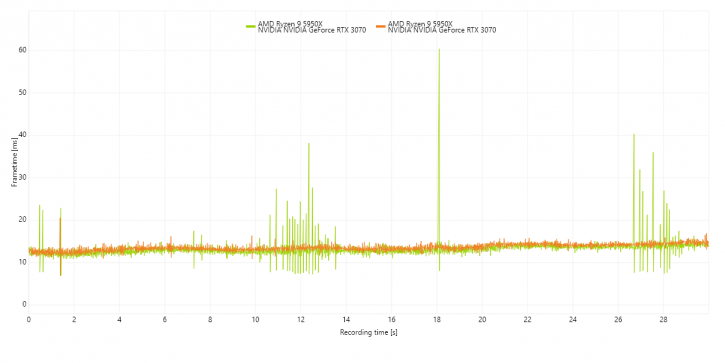
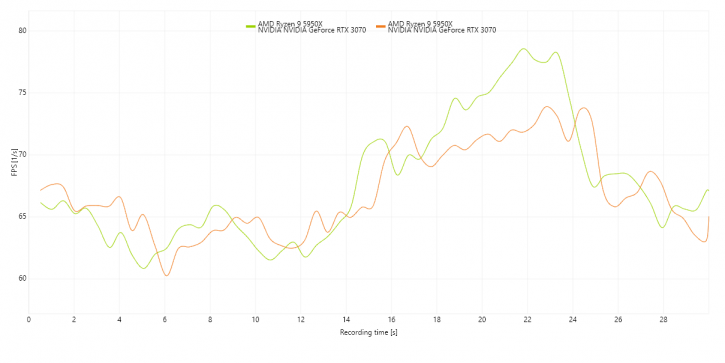
Above F1 2020; we see a decent enough rise in performance to make it worth your while, an increase with reSize BAR enabled can be seen in the frametimes already.
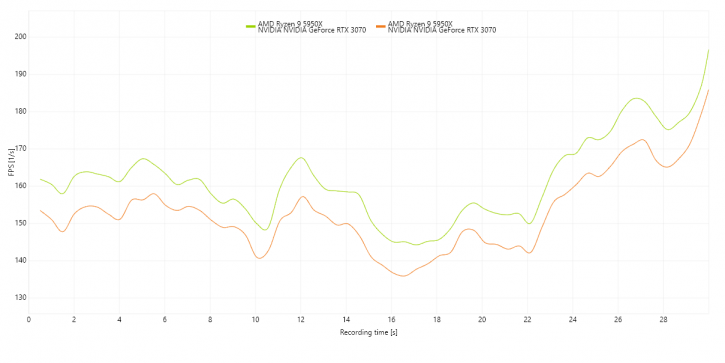
Above F1 2020; that observation is confirmed by the FPS plot.
Above Watch Dogs: Legion. Quite equally linear performance. There's a lot more frame variation going on here than expected though.
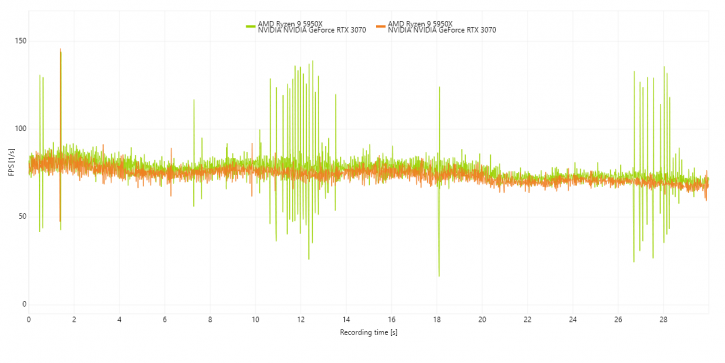
the FPS plot also confirms some oddities.
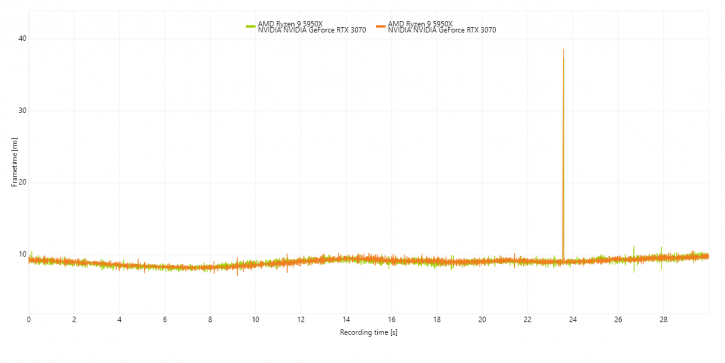
Above: Tomb Raider - an increase for rBAR enabled is there, however, the plot reset itself to a high 45ms axis due to that visual single stutter.
Above: Tomb Raider - a marginal increase for rBAR enabled at best.
Above Assassin's Creed Valhalla, again that one title that benefits from rBAR significantly, the FPS plot below will give a more clear view of that.
Above Assassin's Creed Valhalla in the FPS plot, again that one title that benefits from rBAR significantly.
