FCAT Frame Experience Analysis Watch Dogs
Watch Dogs Frame Experience Analysis
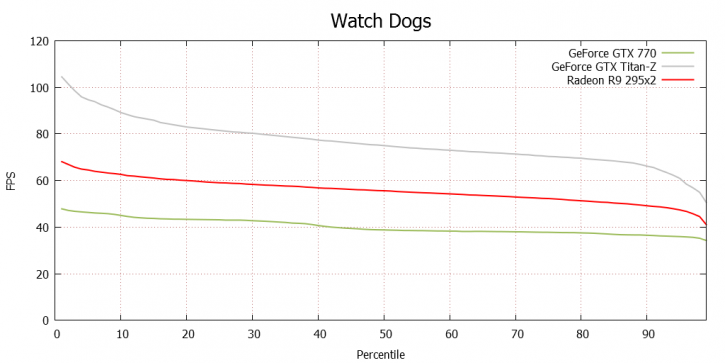
Above, the percentile chart of the 28 seconds gaming @ 2560x1440. Here we plot FPS and place it in relation to percentiles.
- 50% of the time measured frames is doing roughly 70 to 75 FPS, so that is the average framerate (high = better).
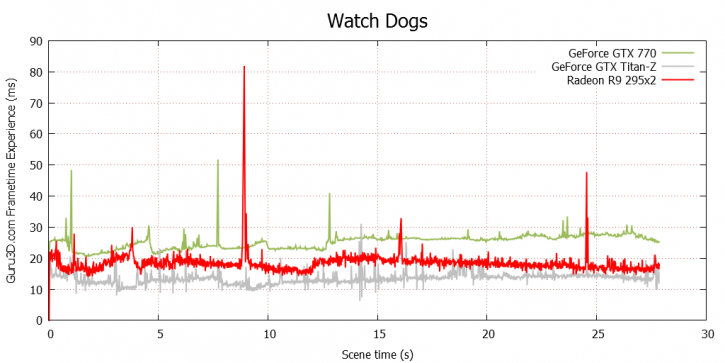
We cannot detect a significant glitch or stutter in frametime scaling (chart wise) that is extremely significant or longlasting. For those that do not understand what you are looking at, the above is a gametime scene recorded for 28 seconds. With this chart, lower = better. Huge spikes above 40 ms to 50 ms can be considered a problem like a stutter or indicate a low framerate.
The one stutter you see on the AMD R9 295x2 is me jumping over a balcony and not landing rather nicely. Overall very good results for the Titan Z and as explained, we lack performance with the AMD R9 295x2 in this title for whatever the reason may be.
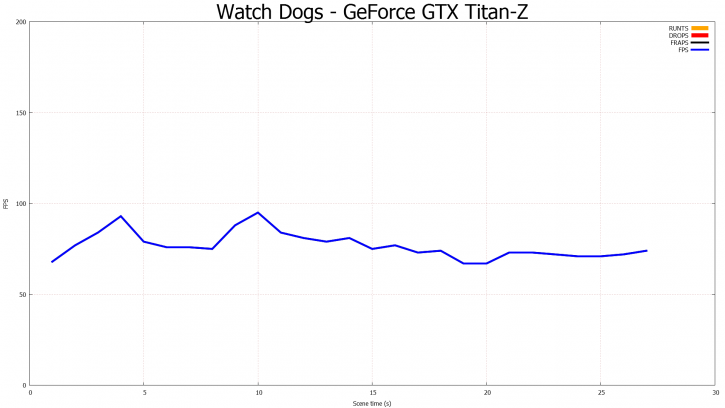
And here the FPS plot for today's tested card, recorded for 28 seconds in the timedemo. Again we stay way above 70 FPS on average at 2560x1440 with ultra quality settings and 2xMSAA, very nice.
