
Image quality settings and benchmark system
Image quality settings and benchmark system
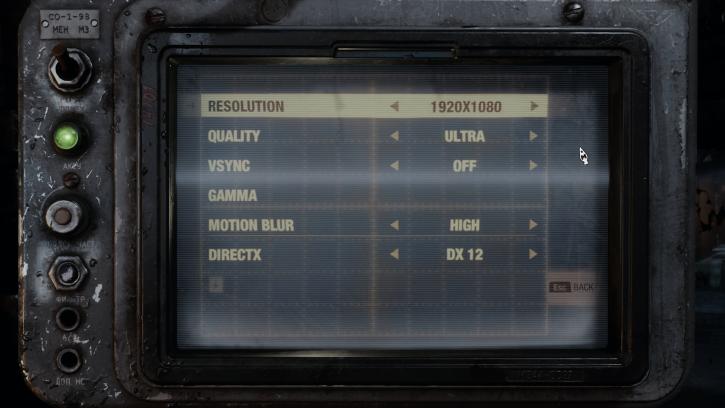
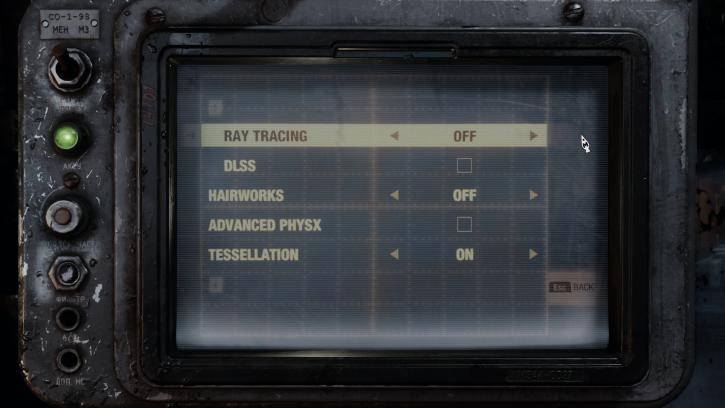
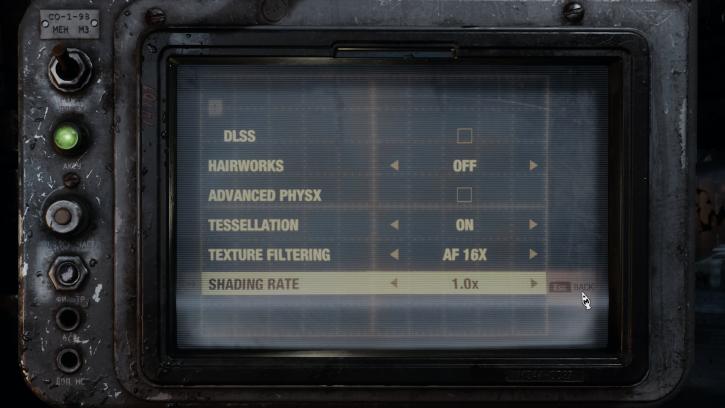
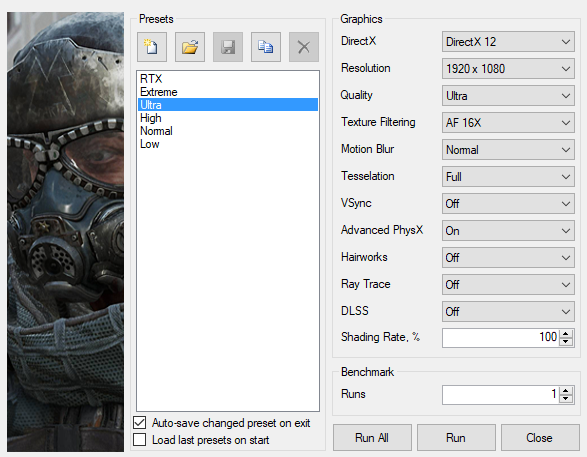
For this game, we use a run with Ultra image quality settings and hairworks disabled, not extreme. We will test several modern age graphics cards in this D3D12 (DXR) and D3D11 compatible title performance wise. Games typically should be able to run in the 40 FPS range combined with your monitor resolution at the very least. From there onwards you can enable/disable things if you need more performance or demand even better game rendering quality. The game is showing plenty of PC graphics options. Gamers also have the ability to change the resolution, limit the frame rate, adjust the field-of-view, adjust effects such as vignettes or motion blur, or resolution scale. You should DX12 as your render path.
Graphics cards tested
In this review, we'll test the following cards at the best PC experience, a slightly mroe balanced quality mode (Ultra) with VSYNC OFF. The graphics cards used in this test:
- Geforce GTX 1050 Ti (4GB)
- GeForce GTX 1060 (6GB)
- GeForce GTX 1070
- GeForce GTX 1070 Ti
- GeForce GTX 1080
- GeForce GTX 1080 Ti
- GeForce GTX 780 Ti
- GeForce GTX 980 Ti
- GeForce RTX 2060
- GeForce RTX 2070
- GeForce RTX 2080
- GeForce RTX 2080 Ti
- GeForce Titan Xp
- Radeon R9 390X
- Radeon R9 Fury
- Radeon R9 Fury X
- Radeon RX 470 (8GB)
- Radeon RX 480 (8GB)
- Radeon RX 570 (8GB)
- Radeon RX 580 (8GB)
- Radeon RX 590
- Radeon RX Vega 56
- Radeon RX Vega 64
- Radeon VII
Benchmark
Test environment (system specification)
Our graphics card test system has been upgraded. The recent tier 1 RTX card have been showing a bit of CPU limitation in the lower resolutions. We are using an eight-core Intel Core i9 9900K processor on the Z390 chipset platform. Next, to that, we have energy saving functions disabled for this motherboard and processor (to ensure consistent benchmark results). We use Windows 10 all patched up. Each card runs on the same PC with the same operating system clone.
System Spec
- Core i9 9900K
- Z390 (ASRock Tachi Ultimate)
- 16 GB DDR4 3200 MHz CL16
- NVMe M.2. SSD WD Black
Graphics drivers
- GeForce graphics cards use the latest 418.91 WHQL driver (download).
- Radeon graphics cards we used the latest AMD Radeon Adrenalin 19.2.1 driver (download).
