
FCAT Frametime analysis
Frametime and latency performance
With FCAT we will look into Frame Experience Analysis. Basically with the charts shown we are trying to show you graphics anomalies like stutters and glitches in a plotted chart. Lately there has been a new measurement introduced, latency measurements. Basically it is the opposite of FPS.
- FPS mostly measures performance, the number of frames rendered per passing second.
- Frametime AKA Frame Experience recordings mostly measures and exposes anomalies - here we look at how long it takes to render one frame. Measure that chronologically and you can see anomalies like peaks and dips in a plotted chart, indicating something could be off.
| Frame time in milliseconds |
FPS |
| 8.3 | 120 |
| 15 | 66 |
| 20 | 50 |
| 25 | 40 |
| 30 | 33 |
| 50 | 20 |
| 70 | 14 |
We have a detailed article (read here) on the new FCAT methodology used, and it also explains why we do not use FRAPS anymore. Frametime - Basically the time it takes to render one frame can be monitored and tagged with a number, this is latency. One frame can take say 17 ms. Higher latency can indicate a slow framerate, and weird latency spikes indicate a stutter, jitter, twitches; basically anomalies that are visible on your monitor.
What Do These Measurements Show?
What these measurements show are anomalies like small glitches and stutters that you can sometimes (and please do read that well, sometimes) see on screen. Below I'd like to run through a couple of titles with you. Bear in mind that Average FPS often matters more than frametime measurements.
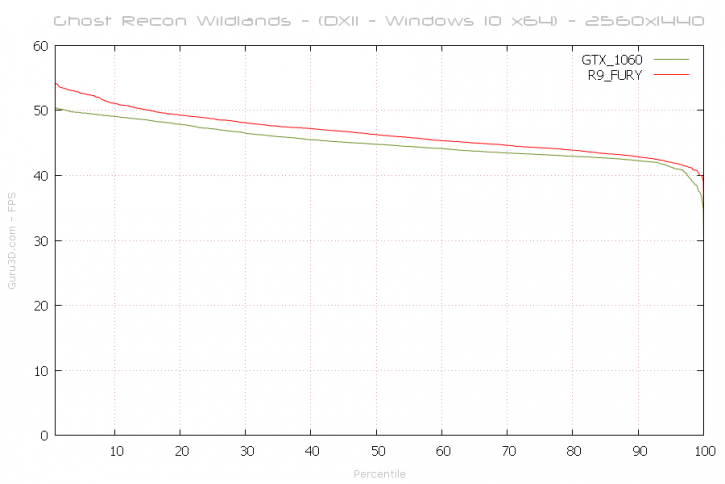
Above an FCAT plot of latency relative to FPS in percentiles. For this run i will use the GeForce GTX 1060 and the Radeon R9 Fury. The cards are nice and close and cuddly to another. The plot is based on the first 31 seconds measured in the benchmark. This is a measurement at 2560x1440 and the 50% percentile could be seen as your average FPS.
Frame Pacing / Frametime
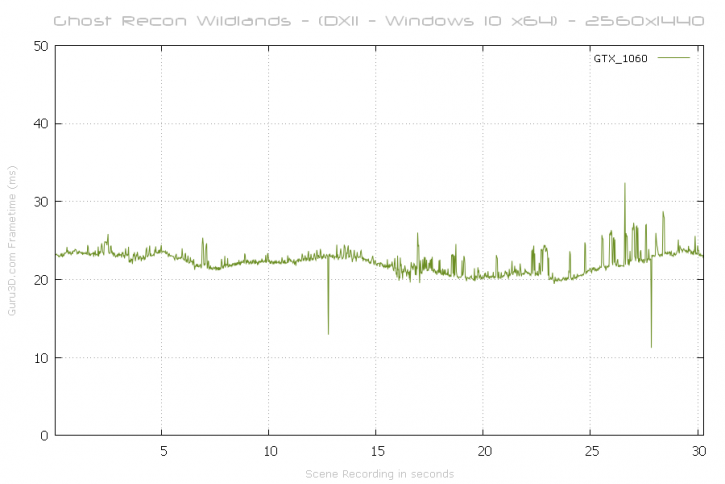
Frame latency them, above a the frame-time results plot of the test run @ 2560x1440 (WQHD). This is the Geforce GTX 1060 6GB. Two minor drops, and sure quite a bit of stuttering is going on there in the last 15 seconds. This is visible on screen.
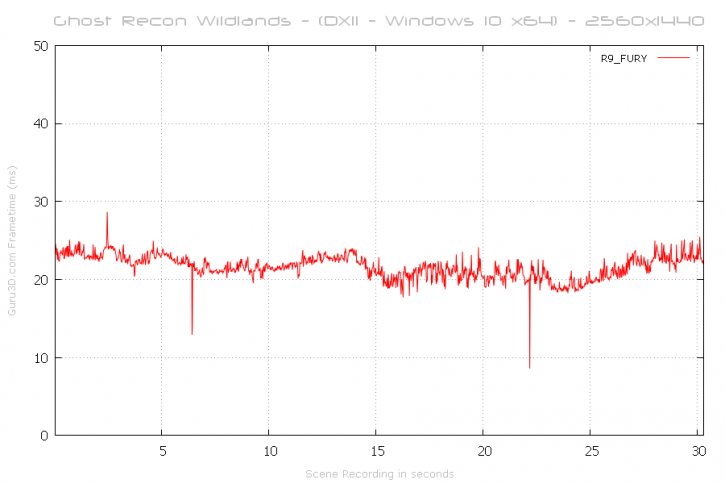
Here (above) we have the Radeon R9 Fury - You'll spot a two framedrops yet here again, we see some inconsistency.
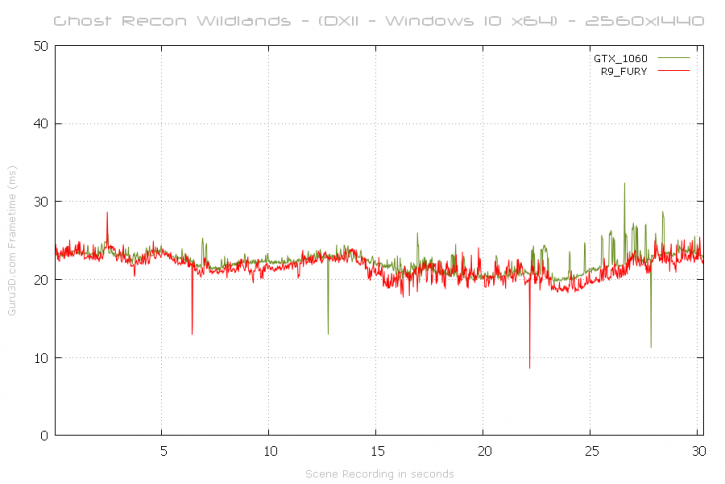
And finally the two cards in an overlay. Basically what you want to see are smooth lines, both vendors are struggling in the benchmark.
