DX12: FCAT Frame Experience Analysis Hitman 2016
Hitman 2016 Frame Experience Analysis
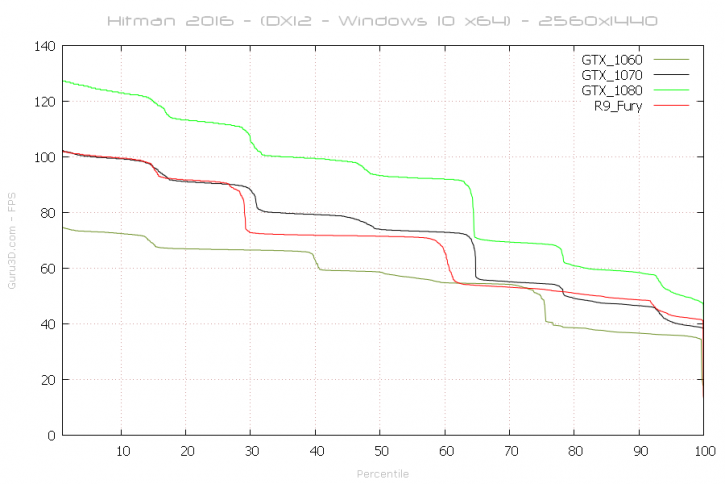
Above, the percentile chart of the 31 seconds gaming @ 2560x1440, this is the intro run of the integrated benchmark. Here we plot FPS and place it in relation to percentiles.
- In green, GTX 1060 - 50% of the time measured frames is doing roughly 58 FPS, so that is the average framerate (higher = better).
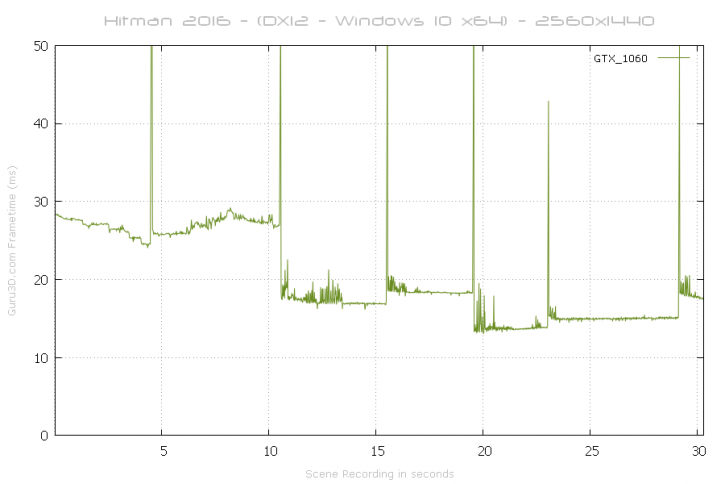
Once we move and plot the frame-time analysis, we cannot detect a significant glitch or stutter in frametime scaling (chart wise) that is extremely significant or long-lasting. Each square step above is a scene change indicating a higher/lower framerate. For those that do not understand what you are looking at, the above is a game-time scene recorded for 31 seconds. With this chart, lower = better. Huge spikes above 40 ms to 50 ms can be considered a problem like a stutter or indicate a low framerate. BTW this is DirectX 12 enabled.
The massive spikes are scene changes, the slower a card is the bigger the effect in the plot. Despite that looking dramatic, it's nothing worrying as this is game engine related.
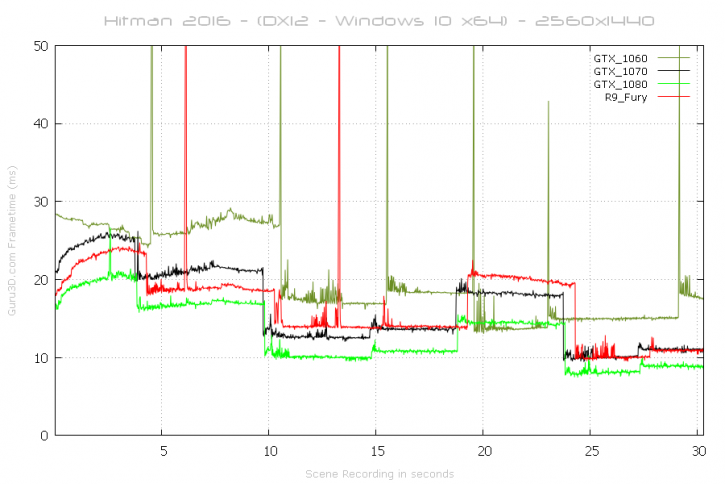
And combined, the GTX 1060 / 1070 / 1080 and the R9 Fury from AMD in the 31 seconds run. Hitman is continuously loading stuff in the background though, even during the benchmark run.
