FCAT Output Results
FCAT Example Output Results
So I just took you through the more relevant hardware and software side of things. In the end on our articles you guys will be merely looking at a handful of charts and the big benefit of FCAT is that we can now present multiple datasets. Plotted Frametime charts, Percentile and Percentage charts but also charts showing what you see with FCAT and FRAPS combined with dropped and Runt frames. Let's simply walk though a handful of examples and let the charts enter your mindset. This is the RAW data converted in a handful plots from FCAT. BTW, in the end we'll be designing our own scaling for our charts as scaling is way off with these.
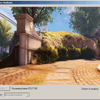
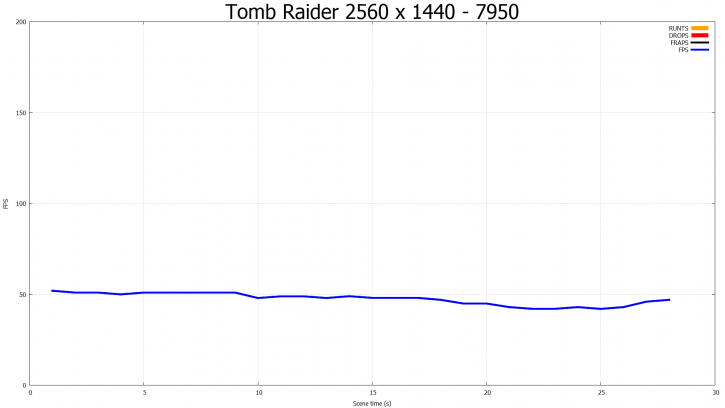
This is Tomb Raider @ 2560x1440 on a Radeon HD 7950 Boost edition:
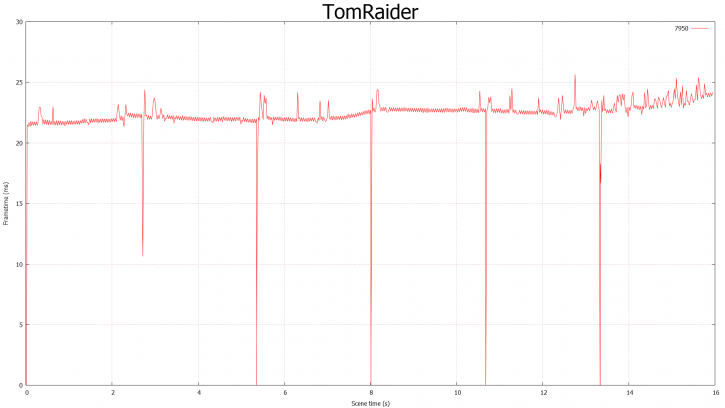
First off a result chart with errors ... we had to find out the hard way that our storage solution was not fast enough. Each four seconds or so the IO reached a bottleneck. It will kill and ruin results. We therefore created a storage solution that as capable of writing faster then 650 Mb/sec. But now some proper examples, all runs are recordings of 30 seconds, this round with a storage solution that is not messing up our results.
But hang on a minute and let it simmer... as this immediately proofs that when something inside the system, GPU or game is wrong we are going to notice it in the charts. Pretty cool.
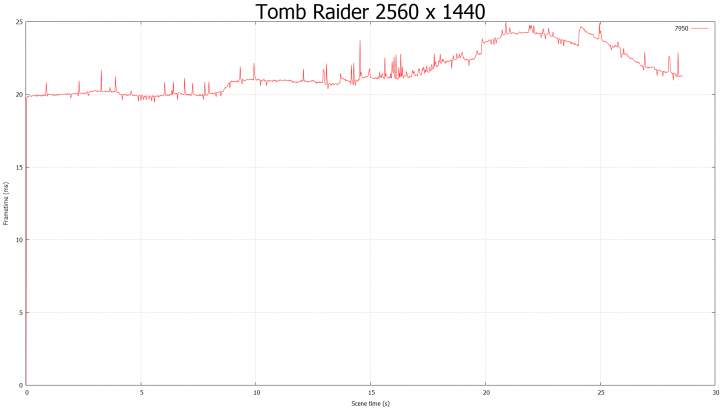
So in our second attempt we are now seeing far better results. Above an R7950 at 2560x1440. You'll notice that here frametime scaling (chart wise) still needs to be altered, the charts are incredibly blown up, but on this 30 Second run the graphics card manages to remain below 25ms, that means we can not detect any anomalies like glitches and stutters. This is a near perfect result really.
For thos that do not understand what you are looking at, the above is a scene rendered. The plot is averaging 19ms to 25ms per rendered frame. With this chart, lower = better. Huge spikes above 40-50ms can be considered a problem or indicate a low framerate.
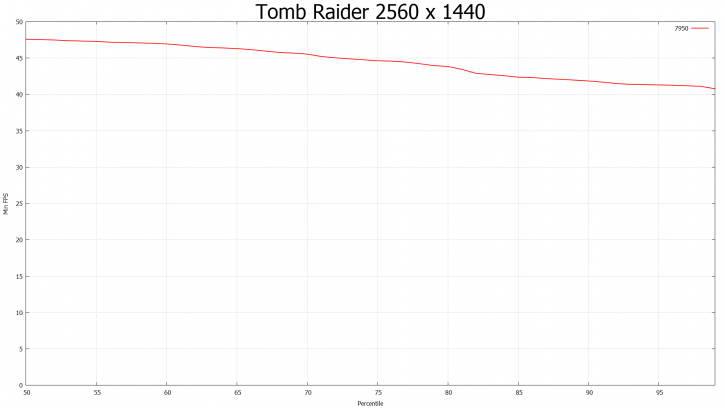
A different chart then - above you can see a percentile chart of the very same run where we plot FPS and place it in relation to percentiles. If you look at the left beginning of the chart, we start at 50% at 47 FPS. This means that 50% of the time measured frames is doing 47 FPS. At the other side of the scope to the right you'll notice that the last 5% of the frames is at 42 FPS or lower. This is another and valid way of looking at performance. BTW the final percentile charts that will end up in the reviews will scale from 1 to 100. So this is merely for demonstration purposes.
Here we have a chart where we can show Runts, Drop, Fraps and FPS. Unfortunately Tomb Raider runs so well that we can't detect any anomalies. So we created some for illustration...
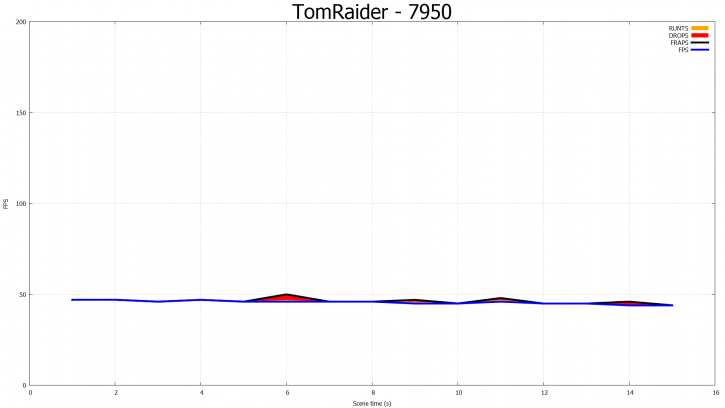
Two important lines in the chart are the Fraps line and the FPS line. The Fraps line is the performance overall measured performance if all frames being delivered are treated as fully formed, evenly spaced, and equally displayed.
- The FPS blue line is the computed performance after dropped frames and runted frames are taken into account.
- Dropped frames are any frame that is sent from a game to the graphics pipeline, is counted by Fraps, but for any reason is NOT displayed on the users display.
- Runt frames are any frame that is sent from a game to the graphics pipeline, counted by Fraps, but for any reason is shown on the screen for an extremely short period of time – So short that the viewer effectively can’t see it.
Guru3D is going to focuss mostly on the Timeframe (game experience) and percentile data, we are not that interested as to what FRAPS reports as in the future, we'll not be using it any more.
