FLIR Thermal images
Thermal Imaging Temperature Measurements
In the past years we have been trying to figure out what the best possible way is to measure temperatures on hardware. Multiple options are available but the best thing to do is to visualize heat coming from the product or component being tested. The downside of thermal imaging hardware is simple, FLIR camera's with a bit of decent resolution costs up-to 10,000 EUR. Hence we passed on it for a long time. With a thermal imaging camera a special lens focuses the infrared light emitted by all of the objects in view. This focused light is scanned by a phased array of infrared-detector elements. The detector elements create a very detailed temperature pattern called a thermogram. It only takes about one-thirtieth of a second for the detector array to obtain the temperature information to make the thermogram. This information is obtained from several thousand points in the field of view of the detector array. The thermogram created by the detector elements is translated into electric impulses. The impulses are sent to a signal-processing unit, a circuit board with a dedicated chip that translates the information from the elements into data for the display. The signal-processing unit sends the information to the display, where it appears as various colors depending on the intensity of the infrared emission. The combination of all the impulses from all of the elements creates the image. We can seek hotspots on the PCB indicating, for example, GPU but also VRM temperature as well as how heat is distributed throughout a product.
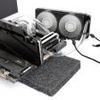
First up, default. Here we see the PC running the combined CPU+GPU stress test. All clock frequencies are defaults including the processor. As you can see, there is nothing significant to see here. All temps are well under control, and that is the effect of liquid cooling really. M1 is the backplate GPU location, M8 the CPU and at M8 the radiator.

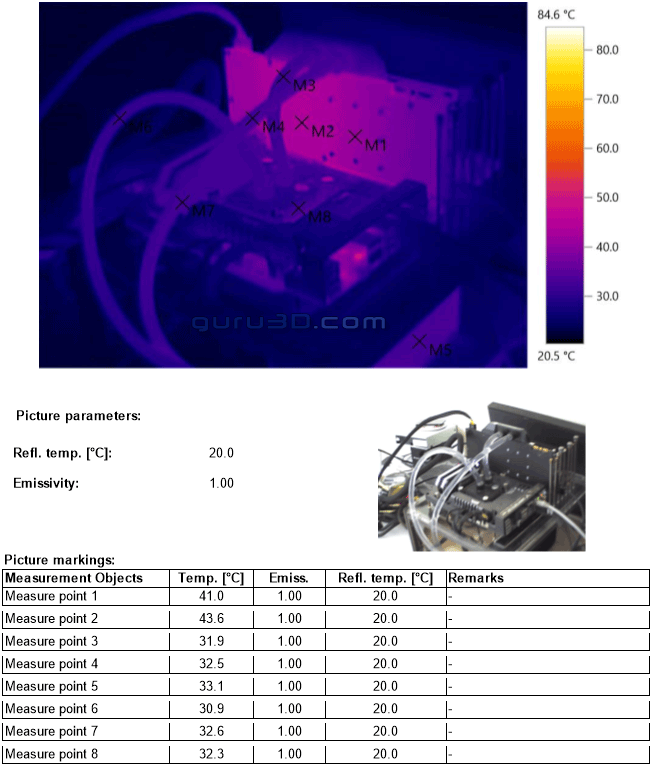
Once we start to overclock the thermal image will start to light up a slightly more. Here we have the CPU at 4.6 GHz @ 1.30 Volts. The GPU is still at default clocks, however the thermals change as the coolant is getting warmer. Overall though, absolutely nothing that seems even remotely worrying.
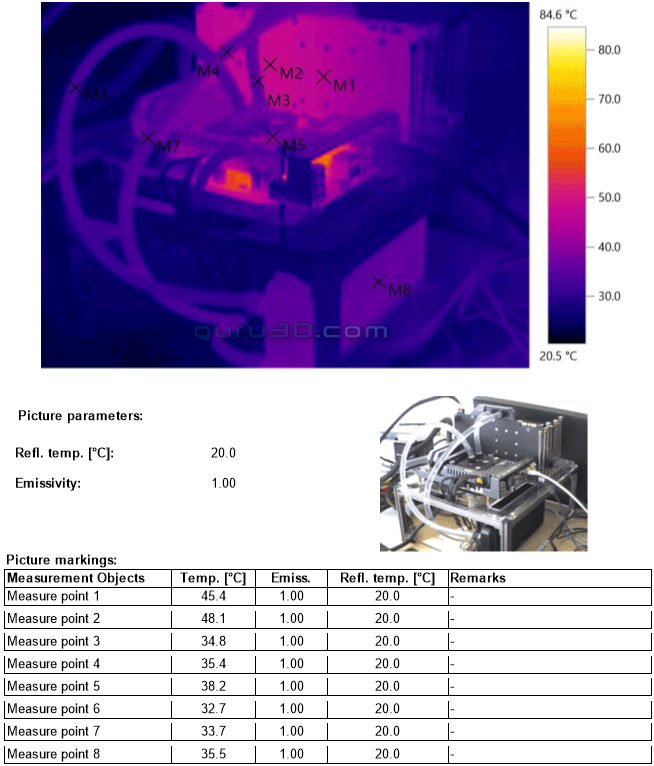
Heavily overclocked then: the thermal image above shows overclocked conditions of the processor and graphics card. The power limiter of the GPU is raised to the MAX meaning we can allow the GPU to utilize way more power/wattage, the Boost clock is running at ~2050 MHz. The CPU runs at 4600 MHz here on all cores with 1.35 Volts on the CPU. At M4 we see the tubing coolant exit temperature at 35 Degrees C. Now compare the first image at the top of this screen (air-cooled with back-plate installed) and the lowest image (back-plate removed / liquid cooled / overclocked). There is a difference. Also funky to see is the VRM area of the motherboard lighting up more now. This is the advantage of liquid cooling, you draw away heat fast and disperse it at another location (radiator).
