
FCAT Frametime Performance Multi GPU
Frametime Performance Multi-GPU
With a benchmark technology called FCAT on the following two pages, we will look into Frame Experience Analysis. Basically with the charts shown we are trying to show you graphics anomalies like stutters and glitches in a plotted chart. Lately there has been a new measurement introduced, latency measurements. Basically it is the opposite of FPS.
- FPS mostly measures performance, the number of frames rendered per passing second.
- Frametime AKA Frame Experience recordings mostly measures and exposes anomalies - here we look at how long it takes to render one frame. Measure that chronologically and you can see anomalies like peaks and dips in a plotted chart, indicating something could be off.
| Frame time in milliseconds |
FPS |
| 8.3 | 120 |
| 15 | 66 |
| 20 | 50 |
| 25 | 40 |
| 30 | 33 |
| 50 | 20 |
| 70 | 14 |
We have a detailed article (read here) on the new FCAT methodology used, and it also explains why we do not use FRAPS anymore. Frametime - Basically the time it takes to render one frame can be monitored and tagged with a number, this is latency. One frame can take say 17 ms. Higher latency can indicate a slow framerate, and weird latency spikes indicate a stutter, jitter, twitches; basically anomalies that are visible on your monitor.
What Do These Measurements Show?
Basically, what these measurements show are anomalies like small glitches and stutters that you can sometimes (and please do read that well, sometimes) see on screen. Below I'd like to run through a couple of titles with you. Bear in mind that Average FPS matters more than frametime measurements.
Frame Pacing Enhancements Multi GPU
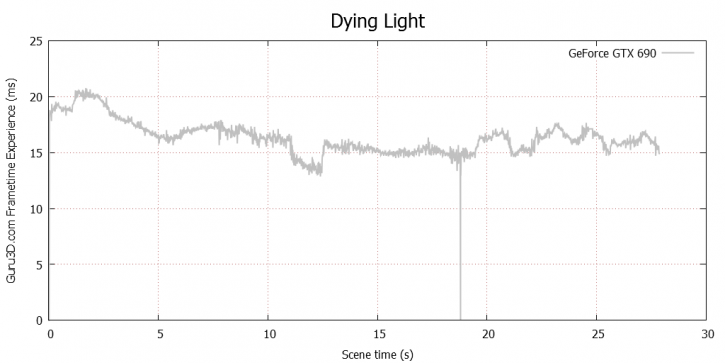
Above an GeForce GTX 690 rendering in SLI mode. As you can see, the results are near perfect with very little deviation in frame pacing. meaning you are looking at excellent frame-rates without micro-stuttering or serious enough anomalies. There is one recorded frame-drop as you can see, in the grand scope of roughly 1700 rendered frames this is not even trivial.
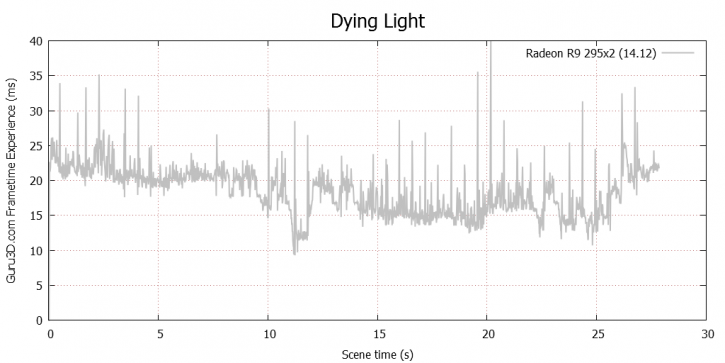
As our benchmarks will show, the Radeon R9 295x2 is tested for Crossfire scaling as well, and the performance is pretty horrendous. With Afterburner we do see that the two GPUs are active and rendering, the gameplay however was as stutter-fest.
If you look above we can actually detect the stutters with our frametime recording really well. The spikes at 30~40ms are very noticeable visually on screen.
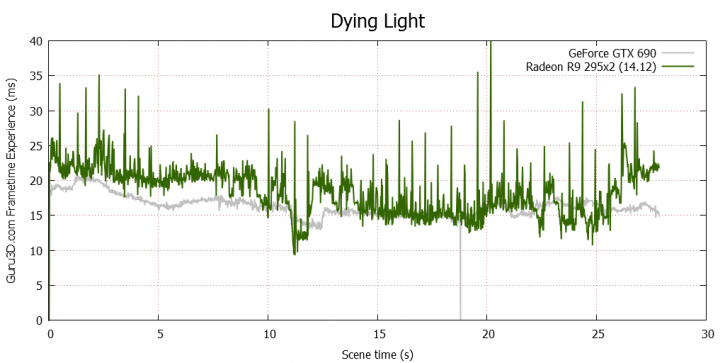
And once we layer the the graphs of both the Crossfire and SLI card, you'll notice very the deviation.
