Testing methodology and Thermography
The CPU stresser
We test processor coolers following a strict protocol. We already have shown you the BIOS settings for the overclock. To stress the CPU we apply the stress modes (default/OC 1.2V /OC 1.3V) and have our stress software Prime95 finish a full run. If Prime95 returns an invalid result, the overclock failed. This did not happen. We did however have a security feature enabled, if a cooler reaches 98 Degrees C the system will power down to prevent it from damage. Below a couple of examples of our test runs. We note down the package temperature, the per core temps as such can differ here and there. For LOAD testing we note down the MAXIMUM measured temperature after a full Prime95 run.
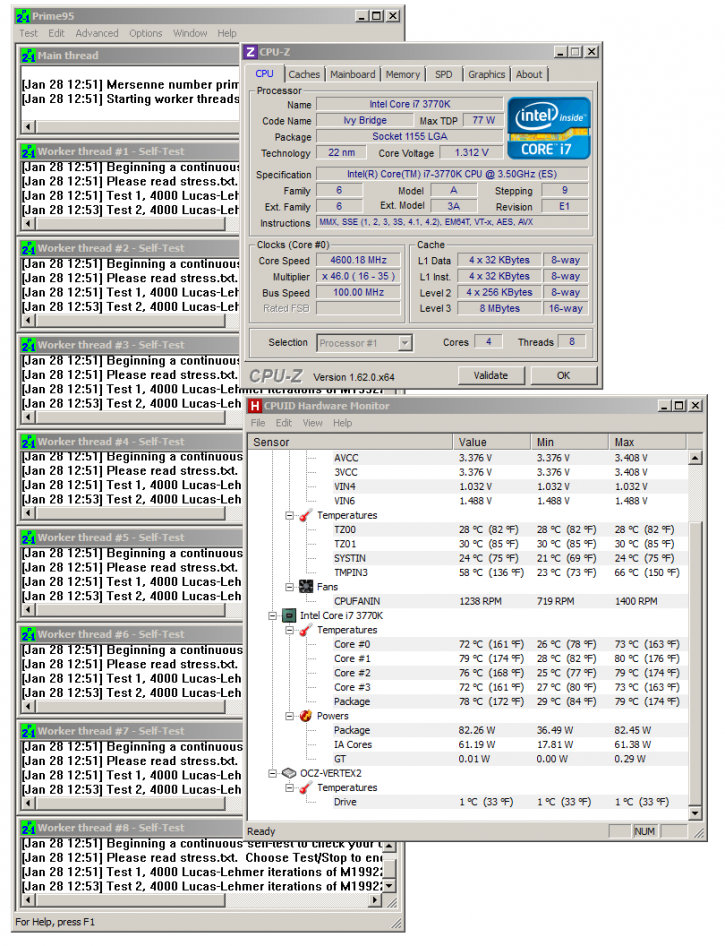
Above you can see the Corsair H75 under stress. In this example we apply a clock setting of 4600 MHz on all CPU cores with 1.2 Volts on the processor.
Thermography
Recently added towards our reviews will be the inclusion of Forward Looking Infra Red thermal images of hardware. Over the past years we have been trying to figure out what the best possible way is to measure temperatures on hardware. Multiple options are available but the best thing to do is to visualize heat coming from the product or component being tested. With a thermal imaging camera a special lens focuses the infrared light emitted by all of the objects in view. This focused light is scanned by a phased array of infrared-detector elements. The detector elements create a very detailed temperature pattern called a thermogram. It only takes about one-thirtieth of a second for the detector array to obtain the temperature information to make the thermogram. This information is obtained from several thousand points in the field of view of the detector array. The thermogram created by the detector elements is translated into electric impulses. The impulses are sent to a signal-processing unit, a circuit board with a dedicated chip that translates the information from the elements into data for the display. The signal-processing unit sends the information to the display, where it appears as various colors depending on the intensity of the infrared emission. The combination of all the impulses from all of the elements creates the image.
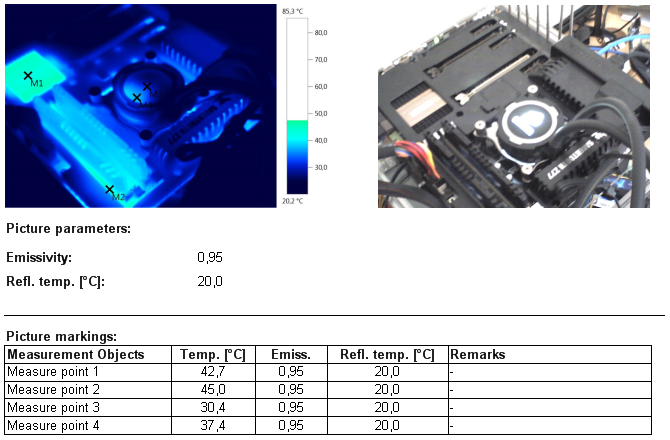
Now the added value of thermography with liquid coolers is relatively small as we cannot measure the CPU this way. The thermal image however does give us a pretty good picture how heat behaves with a liquid cooler installed. That is the sole reason why we include this. The effect of the cooler versus the surround areas. Suffice to say that liquid cooling works really overall on the CPU area of the motherboard PCB and surrounding components.
This thermal image shows the processor under 100% stress overclocked at 4600 MHz with 1.30 Volts applied.
