Performance - CPU-Z | FryRender | CineBench
CPU-Z Internal Benchmark
CPU-Z was recently updated with a fairly quick to run, yet seriously proper benchmark. I decided to include the results as it offers something you can easily replicate and try at home. It actually is a pretty nice little performance measurement to test the RAW CPU performance, next to that the performance is measured both as per core and multi-threaded core performance. Here are some numbers, we'll build up more results over time:
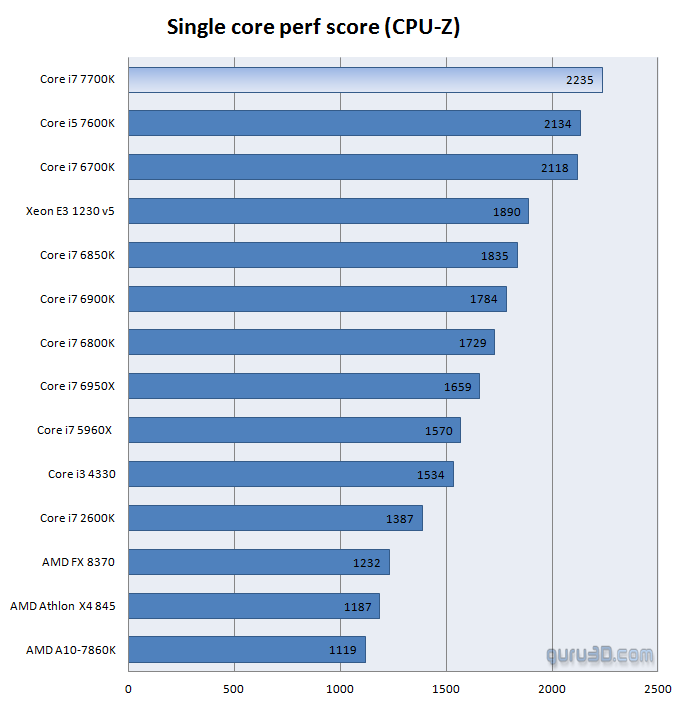
For single core performance it's all about clock frequency, and Intel did apply very high Turbo bins at 4500 MHz for the 7700K. So again, this is per core performance. It is all relative of course, as below we look at multiple cores combined.
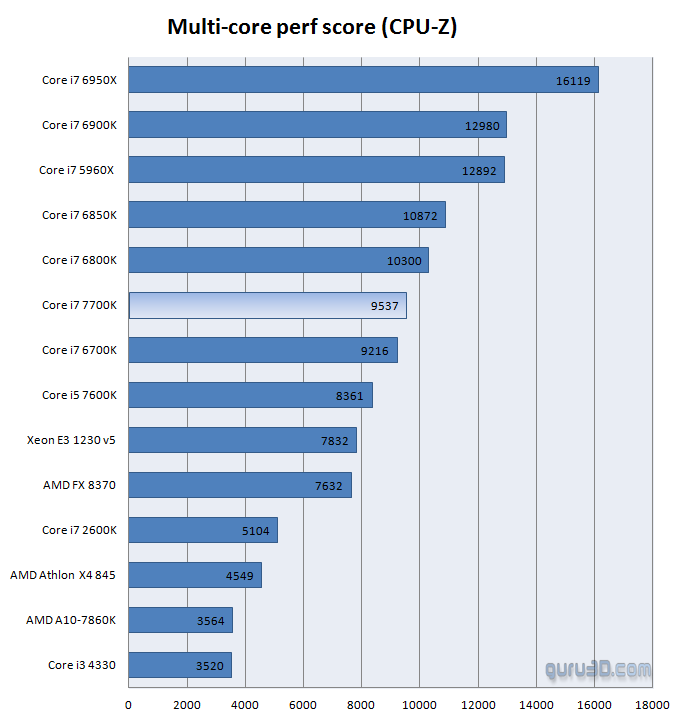
Once you start to accumulate more cores the relative performance will jump up fast, of course. Unfortunately not all software makes use of many cores/threads, including games, hence per core perf matters more opposed to having, say, 8 cores over a quad-core processor.
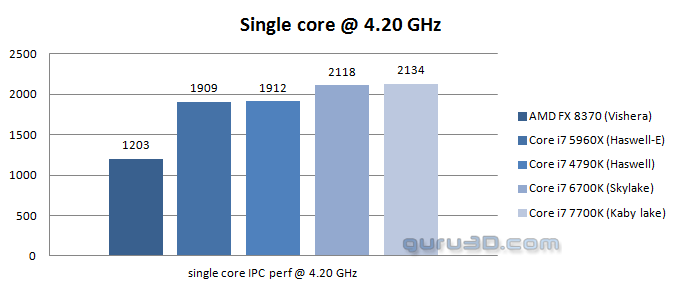
What about actual IPC clock for clock performance then? Well, the Core i7 6700K runs at a 4.20 MHz turbo, the Core i7 7700K at 4.50. We can easily normalize that and downclocked the 7700K cores to 4200 MHz. Aside from a minor platform offset, as you can see, an Intel core is an Intel core. Once you clock them the same, they perform (roughly) the same. This actually has not changed in hugely massive steps ever since Sandy-Bridge in 2011. IPS perf did advance from Haswell to Skylake and now Kaby Lake, we are however talking roughly 10% there. Some processor series however have been able to reach higher turbo bins, Kaby Lake certainly can manage good and high clocks though.
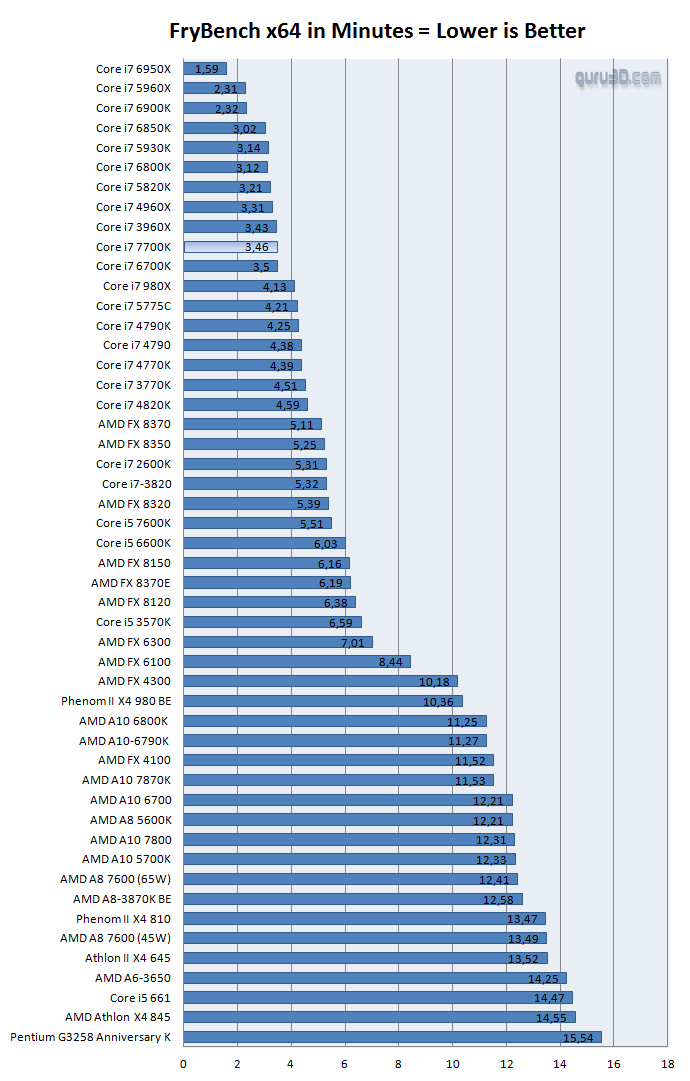
Processor Performance: FryRender
FryRender is a benchmarking framework for everyone, not just for 3D users; anyone out there, from hardware integrators or hardware reviewers to die-hard gamers. Since its conception, FryRender has been designed with the aim of being the most muscled engine in its category. As a result, and after several years of intense development, FryRender's core doesn't let a single CPU cycle be wasted. Its routines have been written to be cache efficient, and to take the maximum advantage possible of the new multi-threading capabilities present in modern CPU architectures. Being a highly-optimized and extremely math-intensive application (mostly in floating-point) which makes a very efficient use of the system's cache, we think that FryRender is the near perfect tool for measuring "how much brute computational power" a computer is able to deliver.
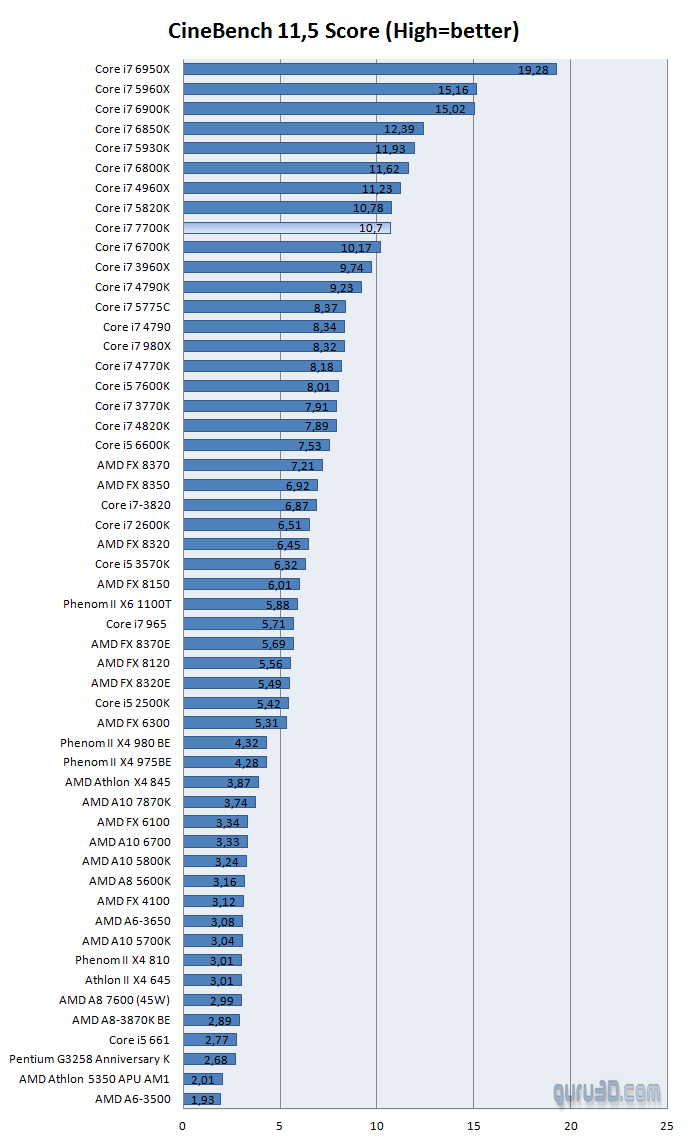
Processor performance: CineBench 11.5
CINEBENCH is a real-world cross platform test suite that evaluates your computer's performance capabilities. CINEBENCH is based on MAXON's animation software CINEMA 4D, which is used extensively by studios and production houses worldwide for 3D content creation. MAXON software has been used in blockbuster movies such as Spider-Man, Star Wars, The Chronicles of Narnia and many more. This test scenario uses all of your system's processing power to render a photo-realistic 3D scene (from the viral "No Keyframes" animation by AixSponza). This scene makes use of various different algorithms to stress all available processor cores.
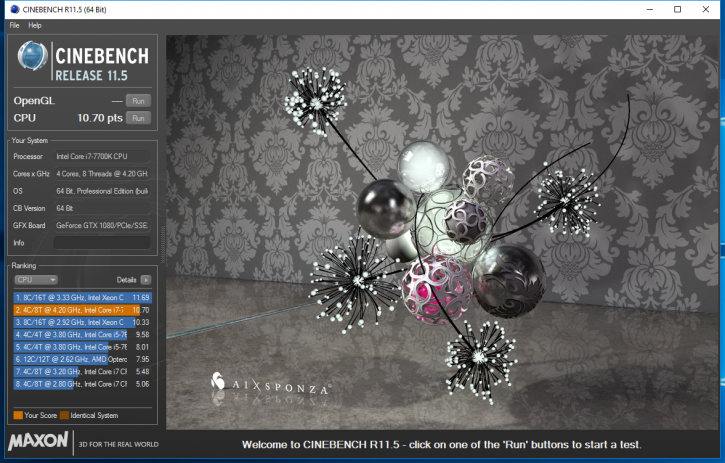
The Cinema 4D engine can use systems with up to 64 processor threads which makes it rather future proof and also excellent for multi-core processors. The test scene contains approximately 2,000 objects containing more than 300,000 total polygons and uses sharp and blurred reflections, area lights and shadows, procedural shaders, antialiasing, and much more. The result is given in points. The higher the number, the faster the processor. In these charts we show you several CPUs and platforms.