
Quality modes, frametimes, CPUs
Quality modes and performance
Right, before we dive into the deeper stuff, we look at the guys and gals on a budget. This game offers four primary quality settings modes from Low to Ultra High. Considering at 1080p even entry-level graphics cards achieve good frame-rates at Ultra high setting, this will be the quality settings used. Hey, you are playing games on a PC, and that is all about the PC experience, proper image quality. While we test at ultra quality settings, we also understand that many people have a budget graphics card.
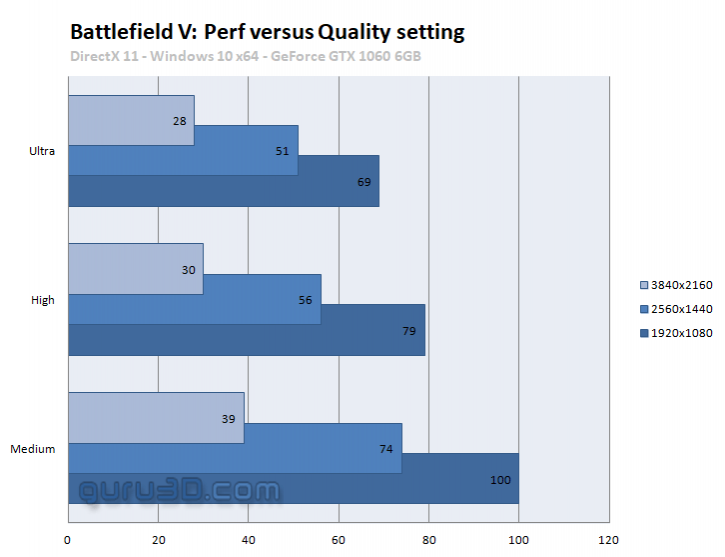
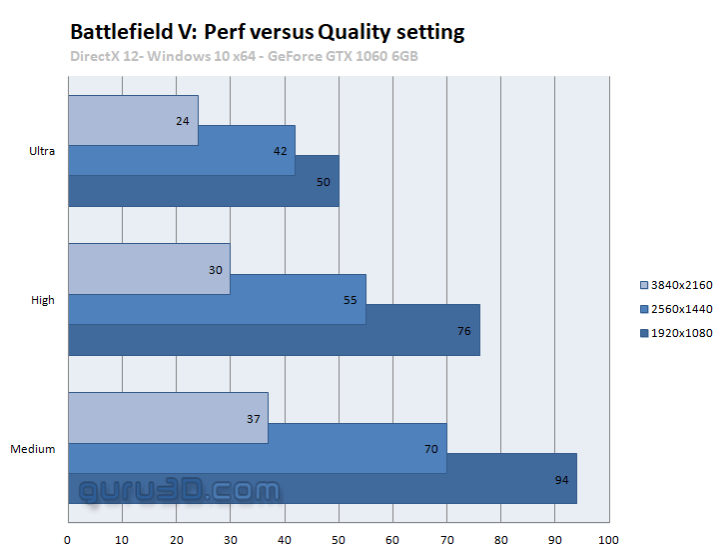
In the above two charts, you can see the differences in performance in-between the three quality modes versus Full HD (1920x1080), WQHD (2560x1440) but also Ultra HD (3840x2160). We tested both DX11 and DX12 as you can observe. Should you need to drop a quality mode performance wise, high-quality mode already makes a substantial enough difference. Low and medium quality modes are just not worth the image quality or performance benefit IMHO (unless you use an IGP or something). The card used above in the chart is merely a GeForce GTX 1060 6GB.
CPU Scaling - AMD Ryzen and Intel
We often get asked, what is the framerate with a Ryzen processor, or what happens if you overclock that Ryzen to 4.0 GHz. So we will do just that. We take a Ryzen 7 2700X and look at a 5960X clocked to 4200 MHz, and then finally the new Core i9 9900K with its intensely high clock frequency.
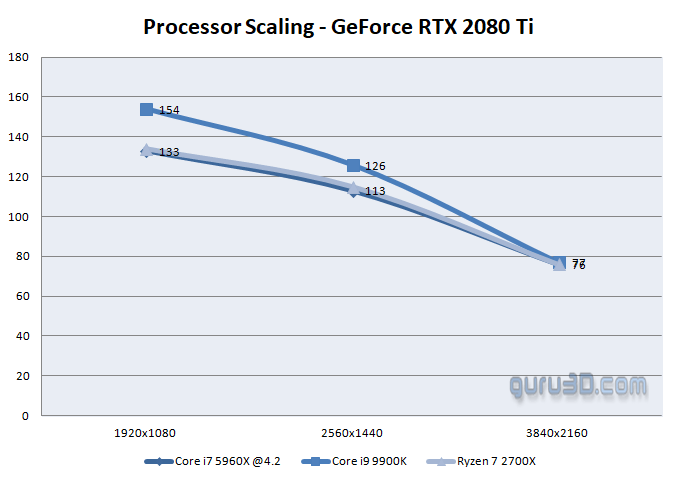
This 8-core CPU test is paired with a GeForce RTX 2080 Ti as it is a heavily CPU limited graphics card. The results show alright with 10 to 15% more FPS in the lower resolutions. With say a GeForce GTX 1080 Ti it all would be more or less the same. But that means, if your graphics card is expensive enough, faster CPU frequencies do matter.
CPU core scaling
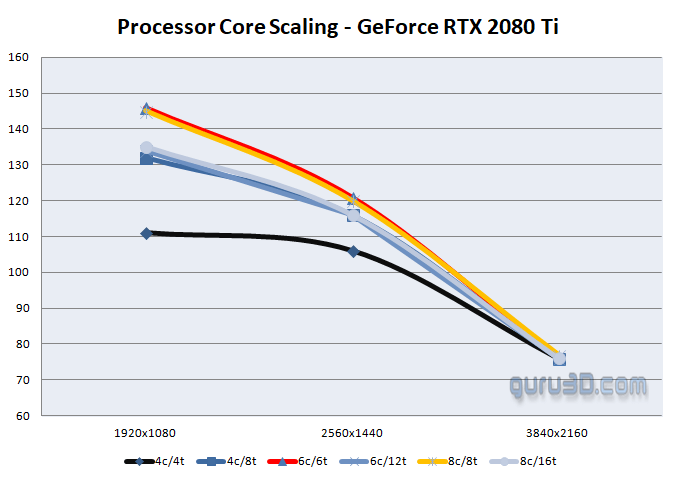
We've also performed some CPU core scaling, and the results are very interesting. Four cores with no SMT/HT performs worst. However, the most interesting observation is that when we disabled hyperthreading in a 6 or 8 core configuration, the performance overall increased substantially in the CPU bound resolutions for the RTX 2080 Ti.
Frametime and latency performance
The charts below will show you graphics anomalies like stutters and glitches in a plotted chart. Frame time and pacing measurements.
| Frame time in milliseconds |
FPS |
| 8.3 | 120 |
| 15 | 66 |
| 20 | 50 |
| 25 | 40 |
| 30 | 33 |
| 50 | 20 |
| 70 | 14 |
- FPS mostly measures performance, the number of frames rendered per passing second.
- Frametime AKA Frame Experience recordings mostly measures and expose anomalies - here we look at how long it takes to render one frame. Measure that chronologically and you can see anomalies like peaks and dips in a plotted chart, indicating something could be off.
We have a detailed article (read here) on the methodology used. Basically the time it takes to render one frame can be monitored and tagged with a number, this is latency. One frame can take say 17 ms. Higher latency can indicate a slow framerate, and weird latency spikes indicate a stutter, jitter, twitches; basically, anomalies that are visible on your monitor. What these measurements show are anomalies like small glitches and stutters that you can sometimes (and please do read that well, sometimes) see on screen. Below I'd like to run through a couple of titles with you. Bear in mind that Average FPS often matters more than frametime measurements.
As you might have observed, we're experimenting a bit with our charts to give it a little more clarity. At the left side, you can see the frame time in milliseconds (ms). At the x-axis, 30 seconds of the game spread out over roughly 1400~1500 frames. Please understand that a lower frame time is a higher FPS (!), so for these charts, lower = better. Huge spikes would be stutters, thicks lines would be bad frame pacing, and the graduate streamlining is framerate variation.
Direct X 12 frametimes
With the frame times and pacing out of the way, we can do some other stuff. The technique used is really handy to measure other stuff to check out behaviouristics.
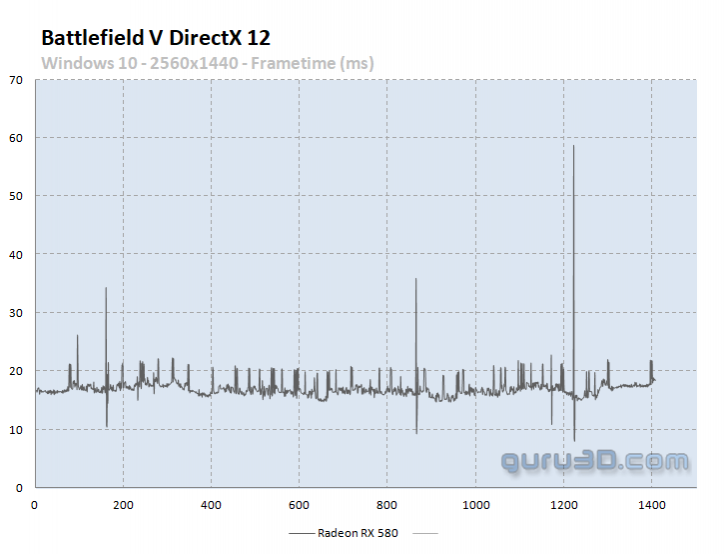
AMD, I took the popular Radeon RX 580 at WHQD here. This frametime result shows what's going on with DX12, lots of small bumps and stutters. The GeForce cards crashed with our frame capture software in DX12 ergo I cannot present you a result for any NVIDIA card (at this time) with DX12. The feel, however, was the same and we expect a similar plot as this is a game engine thing.
DirectX 11 frametimes
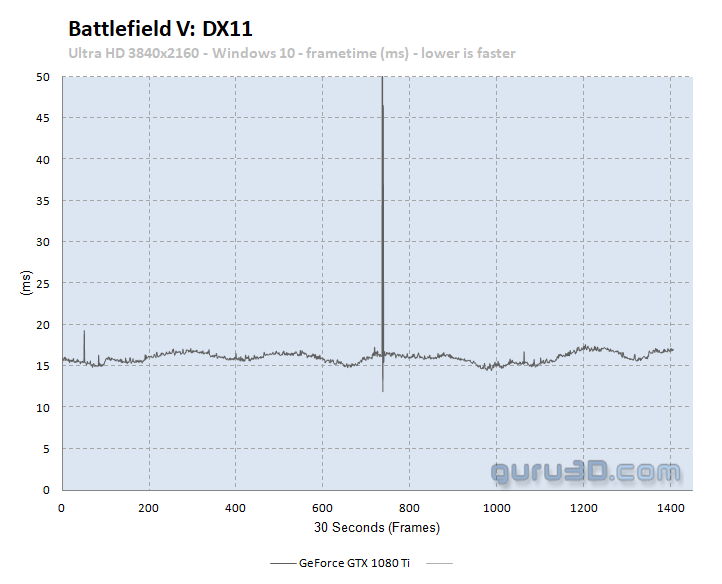
Above you can see a GeForce GTX 1080 Ti at work, that's Ultra HD 3840x2160. Overall much smoother pacing and frametimes. The one (massive) stutter was a real thing alright.
