Testing Regimen
Although we did formal testing on the card it was used in one of our audio review systems for many months prior to the official review to allow for burn in and allow us to get a good idea on the stability of the product. The card was used for everything from checking email to in depth gaming and music/video playback.
Right Mark Audio Analyzer
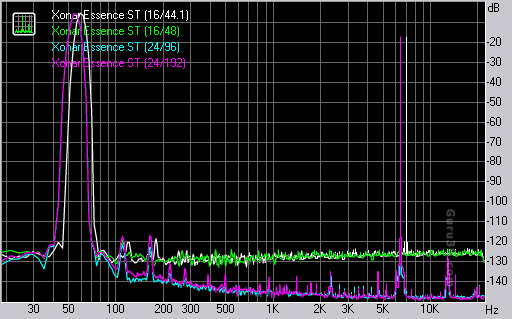
Frequency Response
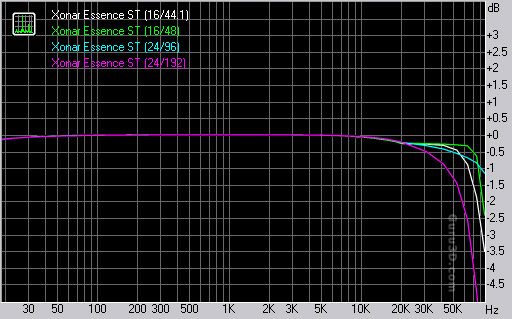
This graph shows the output signal characteristics of the Essence ST. The more linear the graphed line is, the more transparent and neutral the cards audio output is. Variances in the graph would produce coloration in that particular frequency range producing output higher or lower than the remaining frequencies. The Essence ST produced excellent frequency response results during testing.
Notes on above Graph: We have noticed that RMAA has difficulty with scaling on the frequency axis when graphing multiple bit/depths and sample rates. The results are accurate when viewed on their own but the axis scaling is incorrect when comparing one to the others. We have contacted the RMAA authors in hopes they can shed some light on this and possible resolve the issue.
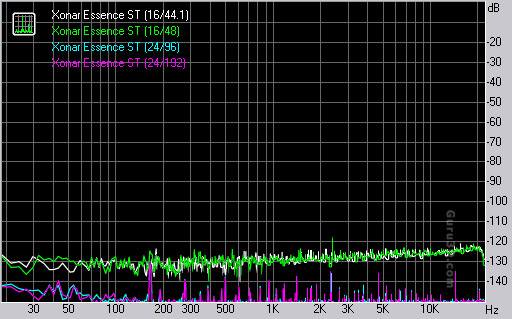
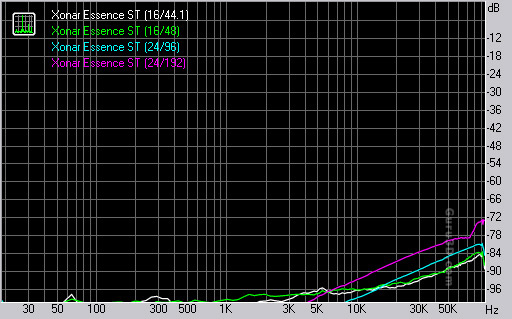
Noise Level
The above graph shows the level of noise present in the cards output signal. There will always be some level of noise present in any audio device but in many cases the level is so low that it is not audible to the human ear. The Essence ST produced excellent noise measurements across the tested ranges.
Dynamic Range
This graph shows the operating range of the ST and the graphs illustrate the lowest and highest range the card is capable of producing accurately. The Essence ST shows an excellent dynamic range across the tested ranges.
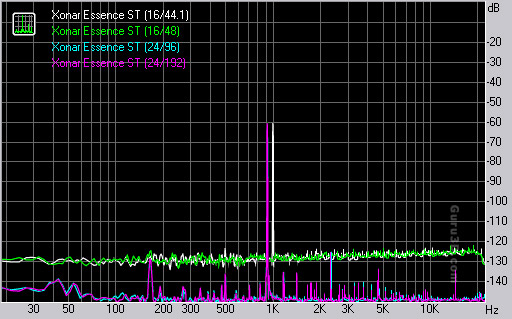
THD + Noise (at -3 dB FS)
The above measurements illustrate how much Total Harmonic Distortion and Noise is present in the cards output signal. Harmonic distortion presents itself as multiple odd and/or even harmonic overtones in the original signal. The lower the measurements are preferred and the Essence ST produced excellent THD+N measurements across the test set.
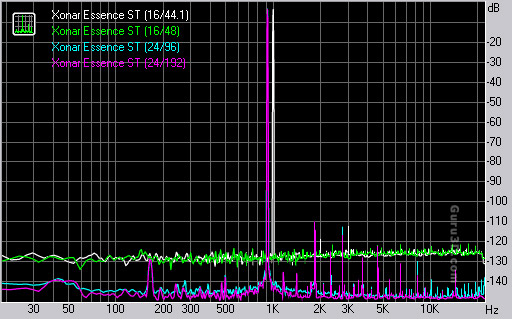
Intermodulation Distortion
The above graph shows the measurement of IMD. This type of distortion results from multiple signals being mixed together and producing distortion in the form of overtones that are not harmonically linked to any of the base signals. Lower values are preferred for any type of distortion tests and the Essence ST produced excellent results through the test sets.
Crosstalk
This graph is a measurement of the bleed-through effect from one stereo channel to the other. The lower the measured crosstalk values are the less bleed through. In our test set the Essence ST produced excellent results. To note, the ST produced some of the lowest crosstalk measurements out of any sources we have tested.
