VRM Area Thermals
VRM Area Thermals
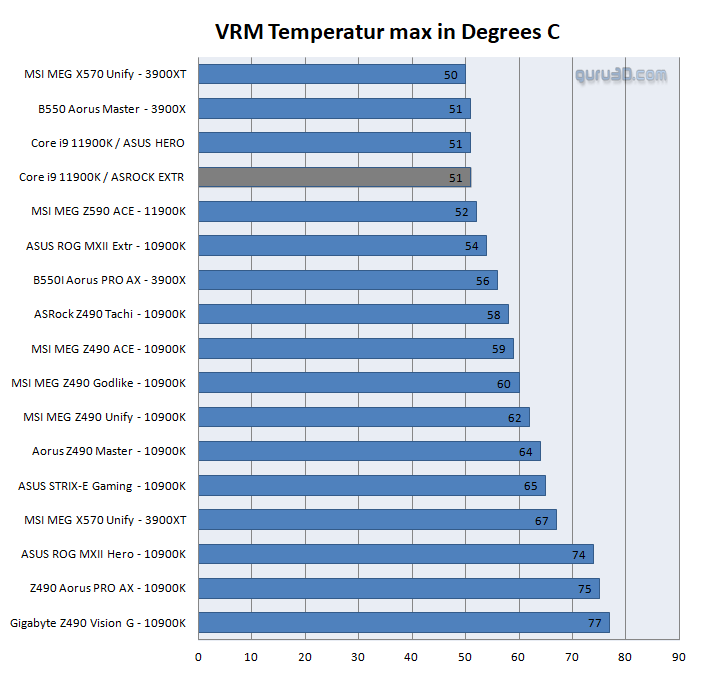
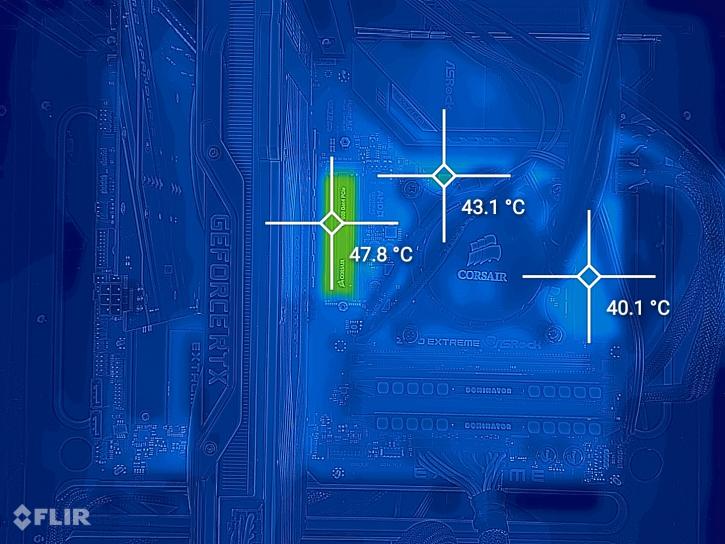
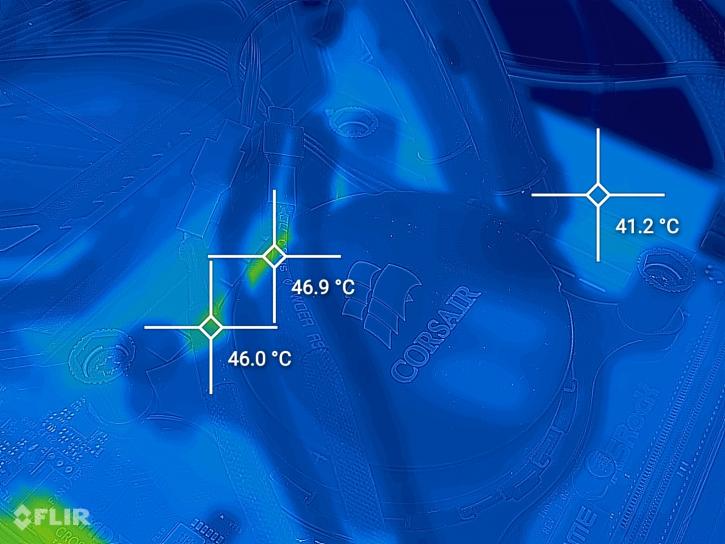
Lately, it has been requested if we could list VRM temperatures. We could hook into sensors and start measuring. Now a good way really is to look at the VRM area with a thermal camera. This way you can detect hot-spots and/or worrying stuff. We run the FPU and CPU torture test in AIDA. The chart plot shows the maximum VRM temperature measured at thermal sensor level. The VRM temperatures you see listed in the chart are not based upon the thermal image, but the max temp reported by the thermal sensors at the VRM stages.
The thermal image is there for visualization of heat bleed, not measurement as most part of the VRM is covered by heatsinks.
- System setup: normal conditions / default settings
- We stat AIDA FPU Stress test, leave it running for 15 minutes, and note down the highest temperature measured on VRM sensors. If there are two VRM loops, we note down the hottest measured temperature.
Note: The ASRock Z590 EXTREME follows very strict reference power states, after a minute it drops the CPU to 3800 MHz on all cores, ergo this prevents the VRM from boverheating. So in normal conditions, this is fine. For manual long-lasting tweaks, the outcome with 50A power stages could be very different.