Backblaze has releases a new listing of HDD failure rates for Q3 2016. They replaced a lot of 3TB with 8TB HDDs and had pretty good results it seems.
For Q3 2016 we have 67,642 drives, or 1,171 fewer hard drives. Stop, put down that Twitter account, Backblaze is not shrinking. In fact, we’re growing very nicely and are approaching 300 petabytes of data under our management. We have fewer drives because over the last quarter we swapped out more than 3,500 2 terabyte (TB) HGST and WDC hard drives for 2,400 8 TB Seagate drives. So we have fewer drives, but more data. Lots more data! We’ll get into the specifics a little later on, but first, let’s take a look at our Q3 2016 drive stats.
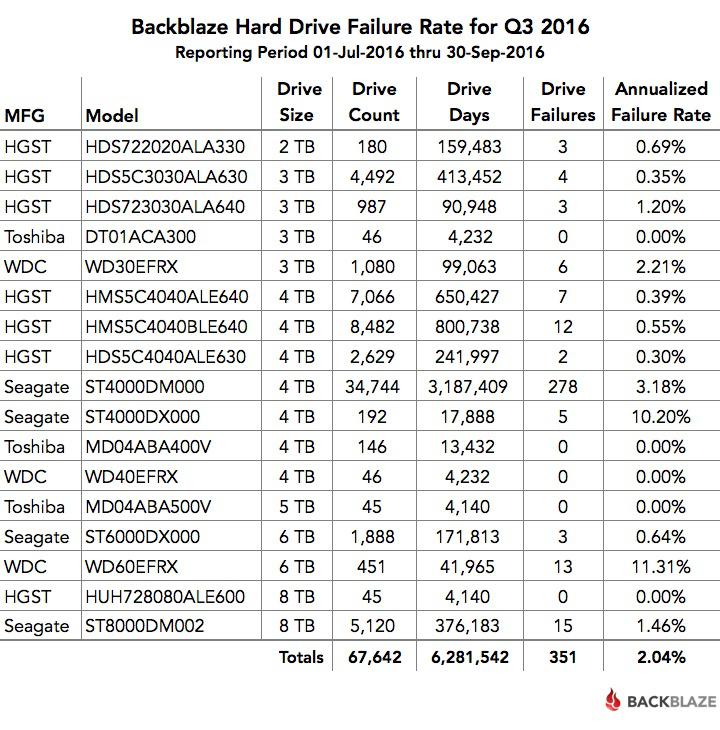
Backblaze hard drive reliability stats for Q3 2016
Below is the hard drive failure data for Q3 2016. This chart is just for the period of Q3 2016. The hard drive models listed below are data drives, not boot drives. We only list drive models that have 45 or more of that model deployed.
A couple of comments on the chart:
- The models that have an annualized failure rate of 0.00% had zero hard drive failures in Q3 2016.
- The “annualized failure rate” is computed as follows: ((Failures)/(Drive Days/365)) * 100. Therefore, consider the number of “Failures” and “Drive Days” before reaching any conclusions about the failure rate.
Less is more: The move to 8 TB drives
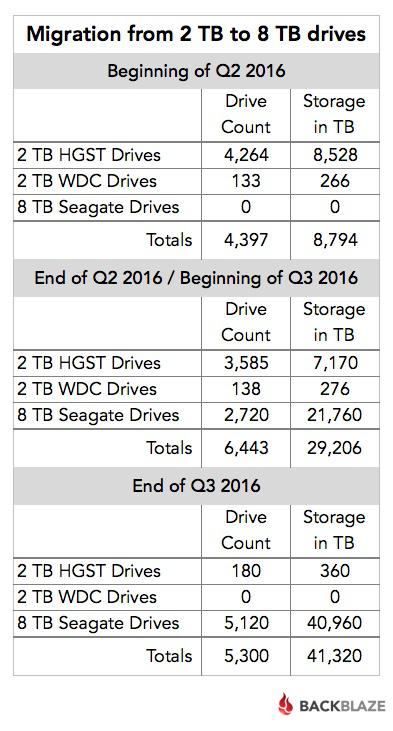
In our Q2 2016 drive stats post we covered the beginning of our process to migrate the data on our aging 2 TB hard drives to new 8 TB hard drives. At the end of Q2, the migration was still in process. All of the 2 TB drives were still in operation, along with 2,720 of the new 8 TB drives – the migration target. In early Q3, that stage of the migration project was completed and the “empty” 2 TB hard drives were removed from service.
We then kicked off a second wave of migrations. This wave was smaller but continued the process of moving data from the remaining 2 TB hard drives to the 8 TB based systems. As each migration finished we decommissioned the 2 TB drives and they stopped reporting daily drive stats. By the end of Q3, we had only 180 of the 2 TB drives left – four Storage Pods with 45 drives each.
The following table summarizes the shift over the 2nd and 3rd quarters.
As you can see, during Q3 we “lost” over 1,100 hard drives from Q2, but we gained about 12 petabytes of storage. Over the entire migration project (Q2 and Q3) we added about 900 total drives while gaining 32 petabytes of storage.
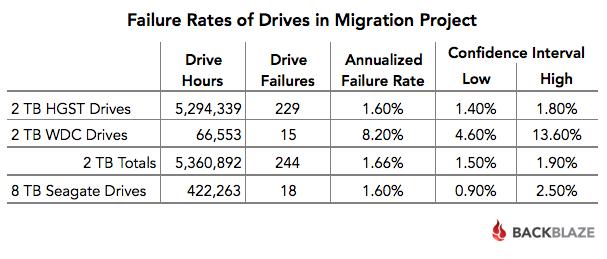
A four-fold storage density increase takes care of much of the math in justifying the migration project. Even after factoring drive cost, migration costs, drive recycling, electricity, and all the other incidentals, the migration still made economic sense. The only wildcard was the failure rates of the hard drives in question. Why? The 2 TB HGST drives had performed very well. Drive failure is to be expected, but our costs go up if the new drives fail at twice or three times the rate of the 2 TB drives. With that in mind let’s take a look at the failure rates of the drives involved in the migration project.
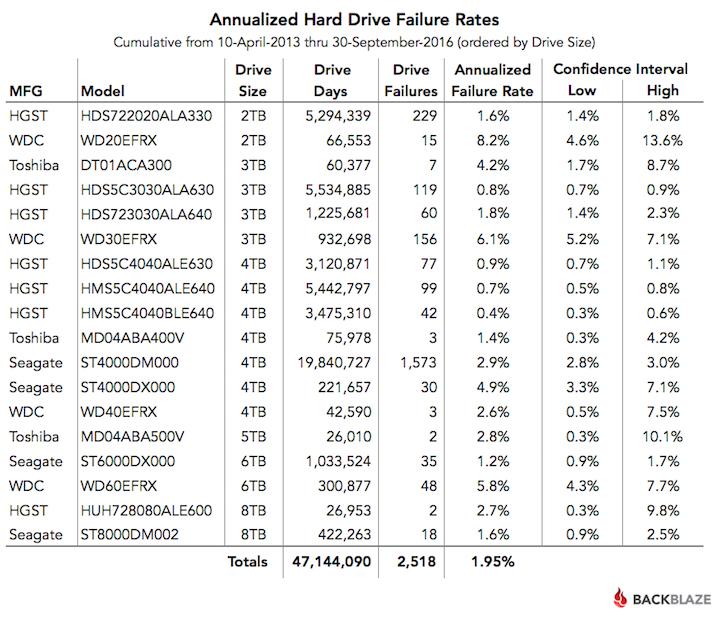
Hard Drive Failure Stats for Q3 2016