DX11: FCAT Frame Experience Analysis Grand Theft Auto V
Grand Theft Auto V Frame Experience Analysis
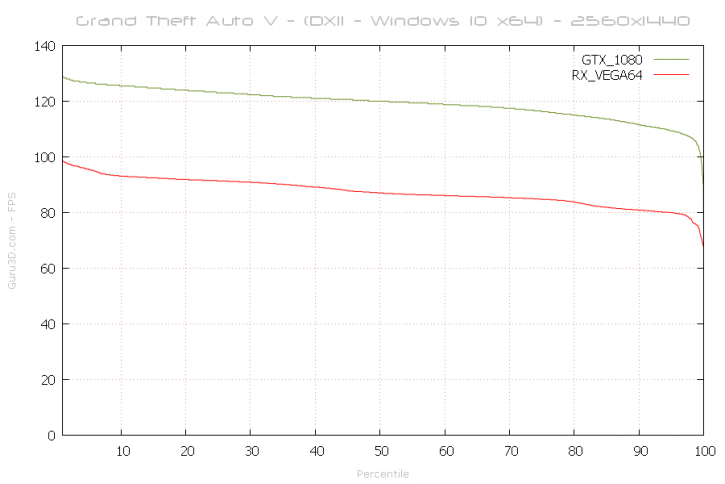
Above, the percentile chart of 31 seconds gaming @ 2560x1440. Here we plot FPS and place it in relation to percentiles. 50% of the time measured frames is doing roughly the average framerate (higher = better).
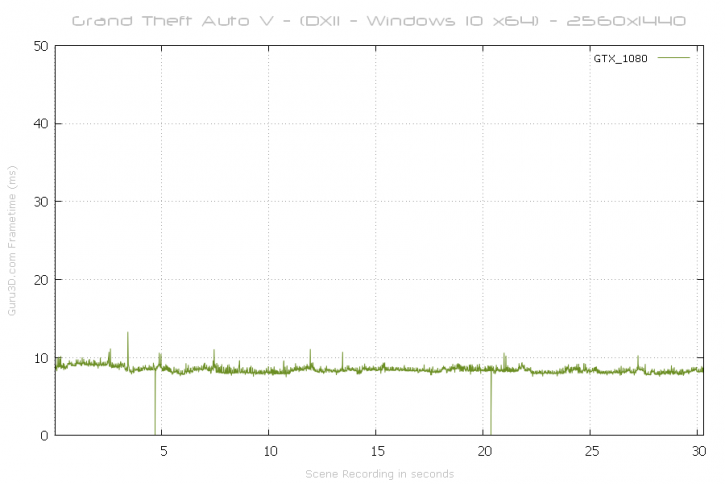
Again we see sheer rendering perfection as we cannot detect a significant glitch or stutter in frame-time scaling (chart wise) that is significant or long-lasting. For those that do not understand what you are looking at, the above is a game-time scene recorded for 31 seconds.
With this chart, lower = better. Huge spikes above 40 ms to 50 ms can be considered a problem like a stutter or indicate a low framerate. As you cans ee we get a bit of a stutter roughly exactly every half second. It is so tiny that we cannot see it, but it is there.
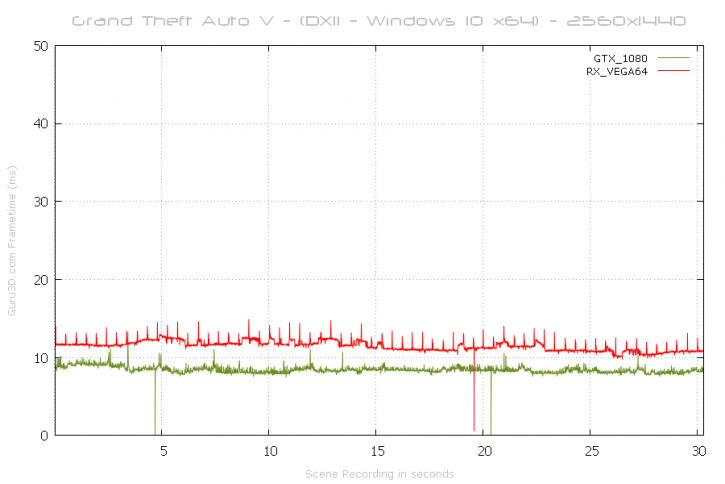
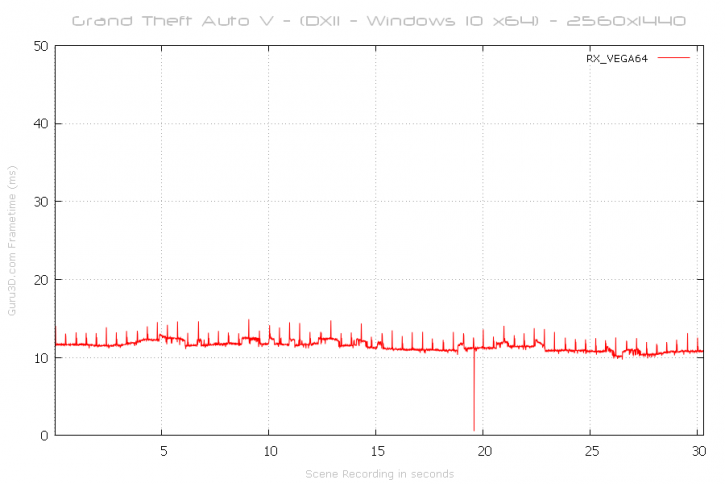
Basically, in this scene we start up the game and walk among other pedestrians in the city. As our regular GTAV results show, AMD is doing worse in overall average performance, and yes FCAT is detecting something going on, albeit as small as that really is as you cannot see it being roughly 2ms at half a second intervals.
