Performance - Single GPU - Alien Isolation
DX11: Alien Isolation
So for the first test title we load up Alien Isolation. This title has a built-in benchmark which is really handy if you are trying to replicate results as consistent as they can be. We'll perform the regular average FPS benchmark run with output results from that internal benchmark and then fire off FCAT to check out and see if there is any relation in-between the dated PCIE Gen 1.1, the modern PCIE Gen 2.0 and then the latest PCIE Gen 3.0
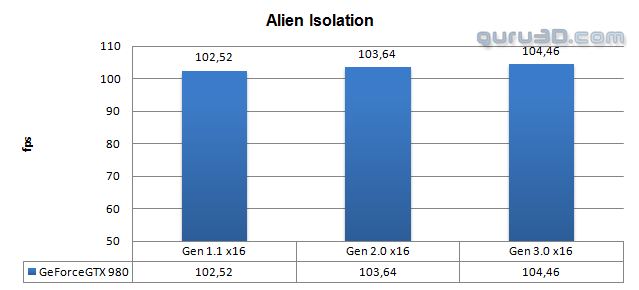
Above the results at the best image quality settings. We will be testing at 2560x1440 (WHQD), we in fact do this with all titles as we want to emulate the way you game at home as close as possible. One could argue that a lower resolution would flood the PCIE bus a little more as with higher framerates there is more data to deal with. We measured and that is still trivial to NIL compared to Full HD at 1920x1080.
As you can see, the average difference was roughly 2% across the board, in fact I had to alter the Y-axis of the charts and set it to start at 50 FPS in order to visually show the difference a little better. With an exception here and there, this is roughly what you will see in terms of performance differences. However this is an average, with FCAT (explained here) we can zoom in and flip things around much better.
FCAT or FACT
With a benchmark technology called FCAT we will look into Frame Experience Analysis. Basically with the charts shown we are trying to show you graphics anomalies like stutters and glitches in a plotted chart. Lately there has been a new measurement introduced, latency measurements. Basically it is the opposite of FPS.
- FPS mostly measures performance, the number of frames rendered per passing second.
- Frametime latency AKA Frame Experience recordings mostly measures and exposes anomalies - here we look at how long it takes to render one frame. Measure that chronologically and you can see anomalies like peaks and dips in a plotted chart, indicating something could be off.
| Frame time in milliseconds |
FPS |
| 8.3 | 120 |
| 15 | 66 |
| 20 | 50 |
| 25 | 40 |
| 30 | 33 |
| 50 | 20 |
| 70 | 14 |
Frametime - Basically the time it takes to render one frame can be monitored and tagged with a number, this is latency. One frame can take say 17 ms. Higher latency can indicate a slow framerate, and weird latency spikes indicate a stutter, jitter, twitches; basically anomalies that are visible on your monitor.
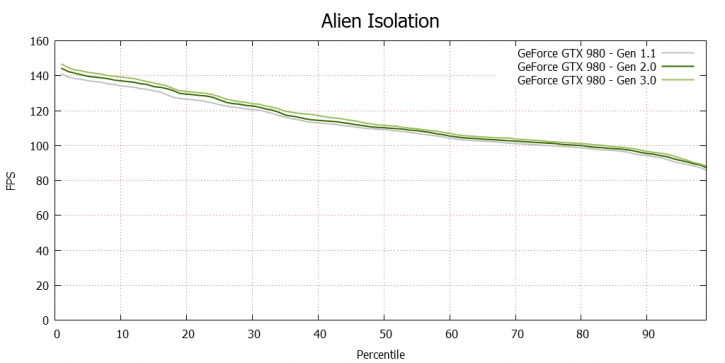
- Grey line - GTX 980 @ x16 Gen 1.1
- Dark green line - GTX 980 @ x16 Gen 2.0
- Light green line - GTX 980 @ x16 Gen 3.0
So the upper chart is an FCAT FPS percentile chart, at 50% we hit 115 FPS meaning 50% of the frames measured in a test-run of one minute renders that FPS. You can see that the grey line (PCIE Gen 1.1 x16) is merely a notch overall slower opposed to gen 3.0 @ x16.
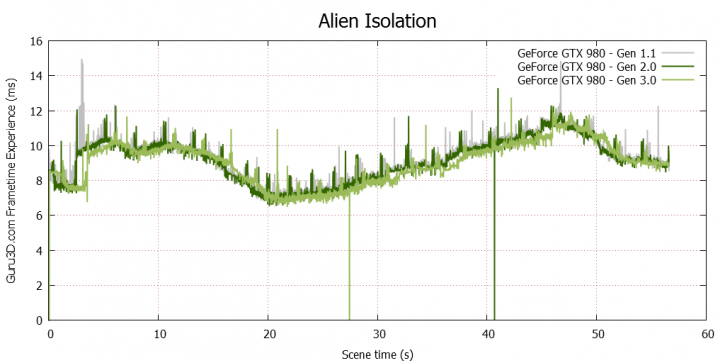
Once we spread out a recording of almost one minute and overlay latency results (lower latency - better) we can see a hint better as to what you are seeing on screen. Since we manually have to start-up the recording, the start of the recording can be a hint shifted. But overall you'll agree with me that the differences are close to each other and not significant enough to make a big change in performance whatsoever.
